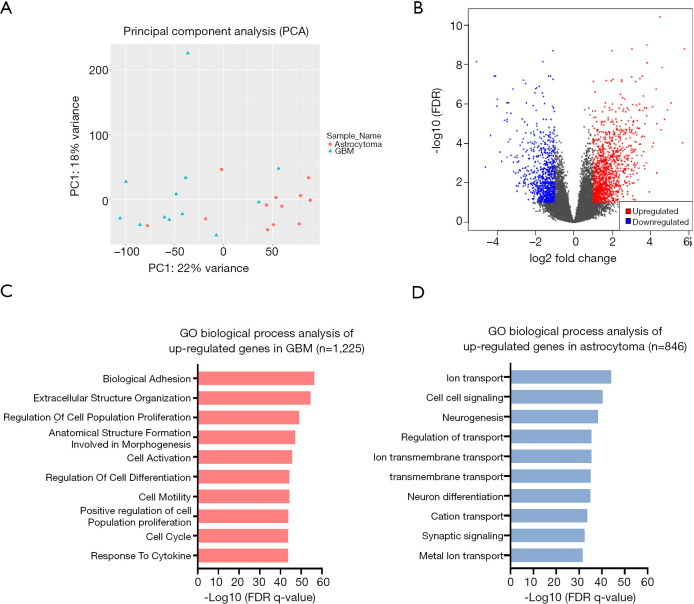
Figure 4.
Differential pathways between astrocytoma and GBM. (A) Principal component analysis was performed in astrocytoma and GBM. The blue dots represent the sample of GBM, and the red dots represent the sample of astrocytoma. (B) Differentially expressed genes (GBM vs. astrocytoma) were analyzed by DESeq2. The upregulated (Log2 fold change ≥1, FDR <0.1) and downregulated (Log2 fold change ≤−1, FDR <0.1) genes were selected and are displayed with a volcano map. The red dots represent the upregulated genes that met the thresholds, and the blue dots represent the downregulated genes that met the thresholds. (C) GO biological process analysis of upregulated genes in GBM. The top10 pathways are shown with red bars. (D) GO biological process analysis of upregulated genes in astrocytoma. The top 10 pathways are shown with blue bars. GBM, glioblastoma; GO, Gene Ontolgoy.

