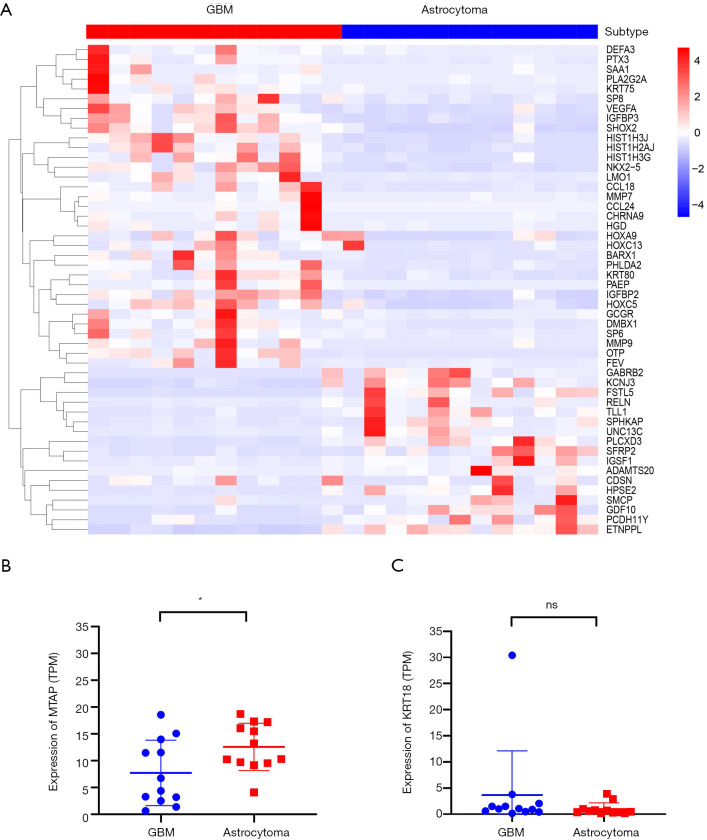
Figure 5.
Differentially expressed genes between astrocytoma and GBM. (A) A heatmap showing the top 50 differentially expressed genes between astrocytoma and GBM. One column represents one sample, and one row represents one gene. (B,C) The expression of MTAP gene (B) and KRT18 gene (C) in astrocytoma and GBM from RNA-seq. *, P<0.05; “ns” means no significance. GBM, glioblastoma.

