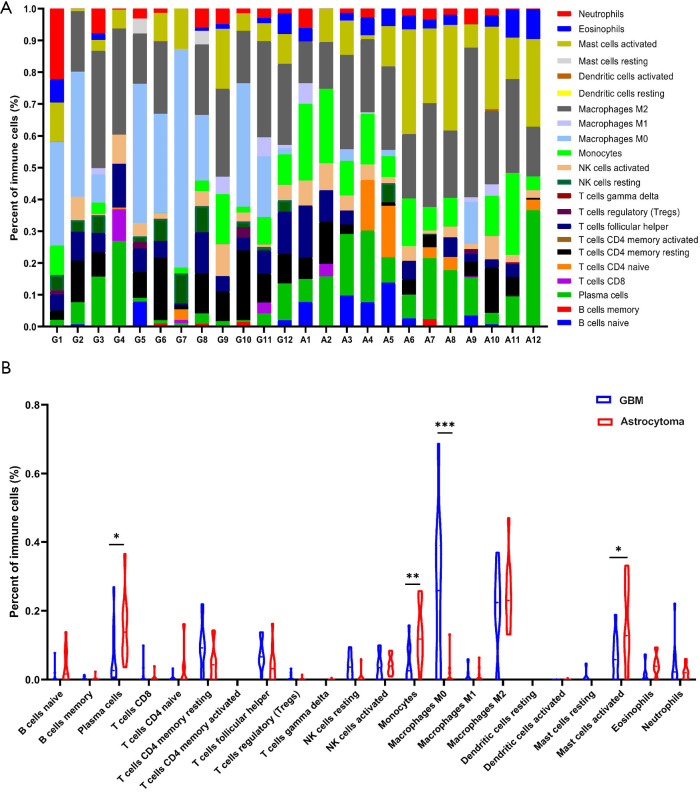
Figure 6.
Immune cell infiltration analysis in astrocytoma and GBM. (A) Infiltration of immune cells in astrocytoma and GBM was analyzed by CIBERSORT with LM22 immune subsets. The percentages of 22 immune cells in every sample are shown with stacking bars. “G” represents the samples of GBM, and “A” represents the samples of astrocytoma. (B) Comparison of the infiltration of immune cells between astrocytoma and GBM. Immune cells with significantly differences are marked. *, P<0.05; **, P<0.01; ***, P<0.001. GBM, glioblastoma.

