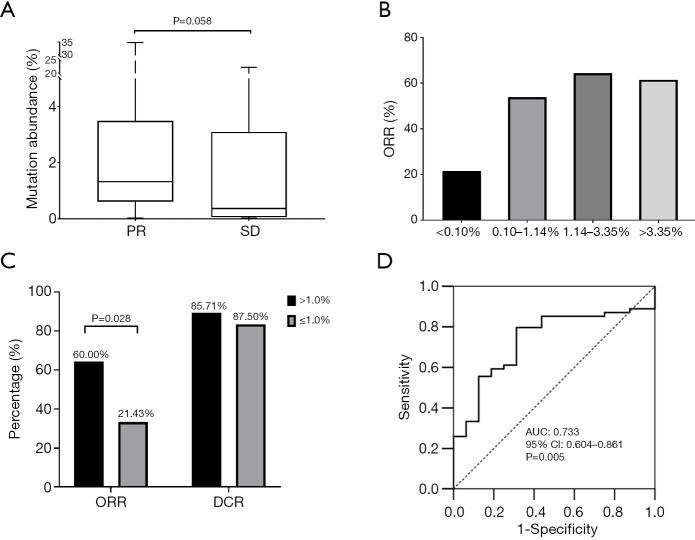
Figure 2.
EGFR mutation abundance and clinical response. (A) Box plot analysis for mutation abundance in patients with PR or SD. (B) ORR stratified by quantiles of EGFR sensitizing mutation abundance in plasma. (C) ORR and DCR of low and high mutation abundance groups. (D) ROC curve and AUC. EGFR, epidermal growth factor receptor; PR, partial response; SD, stable disease; DCR, disease control rate; ORR, objective response rate; ROC, receiver operating characteristic; AUC, area under ROC curve.

