Figure 2.
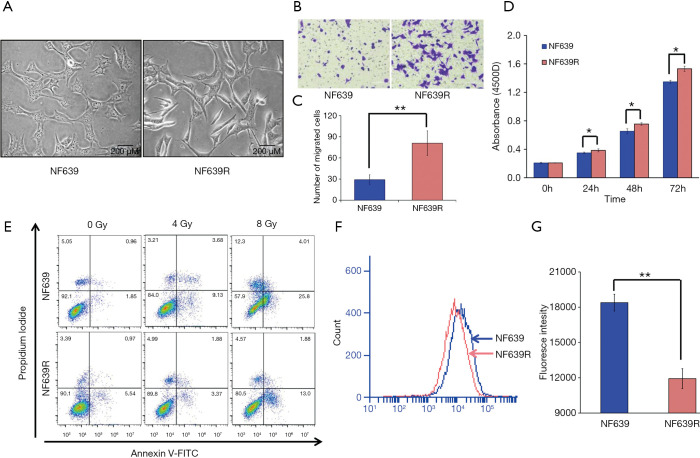
Difference in multiple properties between NF639 and NF639R cells. (A) Morphology of NF639 and NF639R cells. Scale bar, 200 µm. (B) Representative images of the migrated NF639 and NF639R cells stained with 0.2% crystal violet solution. Scale bar, 100 µm. (C) Quantification of migrated NF639 and NF639R cells. (D) Proliferation ability measured with Cell Counter Kit-8 assays in NF639 and NF639R cells. (E) Apoptosis detected with flow cytometry at 72 h after 4 or 8 Gy irradiation. (F,G) Detection of reactive oxygen species using the CELLROX™ DEEP RED in NF639 and NF639R cells. (F) Histogram profiles of NF639 and NF639R cells with flow cytometry. (G) Quantification of mean fluorescence intensity in NF639 and NF639R cells. All data are presented as the mean ± standard deviation from three independent experiments. *, P<0.05; **, P<0.01.

