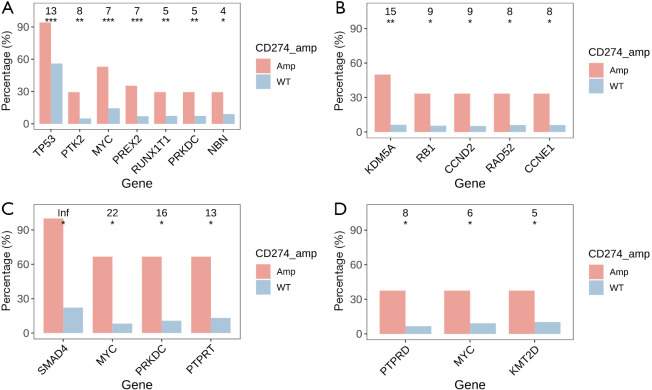
Figure 3.
Distribution of mutant genes in other common cancer types of the cohort. (A) Breast cancer; (B) ovarian cancer; (C) colorectal cancer; and (D) gastroesophageal cancer. The numbers at the top reflect the effect size of each mutant gene indicated by odds ratio (OR). Inf: OR with positive infinity. The P value is indicated with asterisks. *, P<0.05; **, P<0.01; ***, P<0.001.

