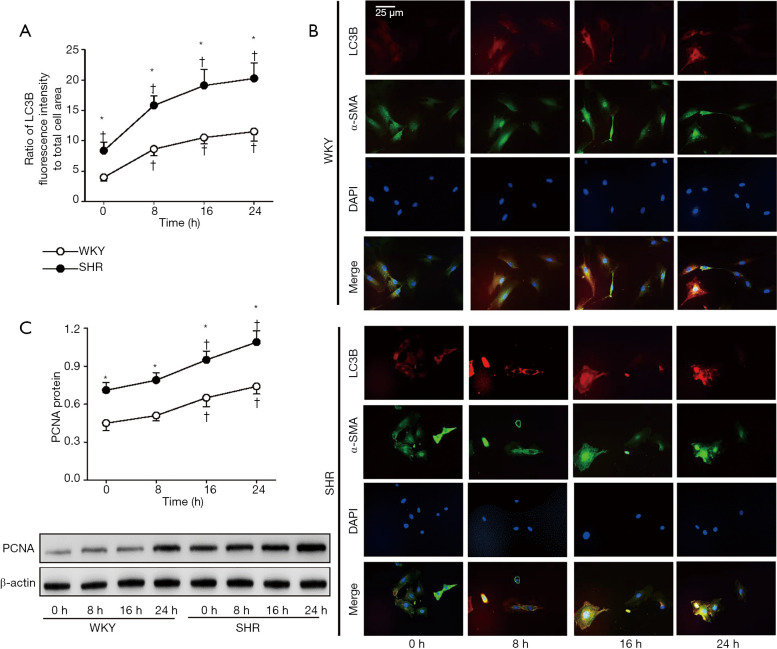
Figure 5.
Time-effects of apelin-13 on LC3B and PCNA expressions in VSMCs of WKY and SHR. LC3B expression was determined with immunofluorescence staining. PCNA expression was examined with Western Blot. The measurements were respectively examined 0, 8, 16 and 24 h after apelin-13 (1 µM) treatment. (A) Relative fluorescence intensity of LC3B normalized with cell area. (B) Representative images of triple immunofluorescence staining for LC3B (red), α-SMA (green) and DAPI (blue). The α-SMA and DAPI staining were respectively used to show VSMC cells and nuclei. (C) VSMC proliferation evaluated with PCNA protein expression. Values are mean ± SE. *, P<0.05 vs. WKY; †, P<0.05 vs. 0 h. n=4.

