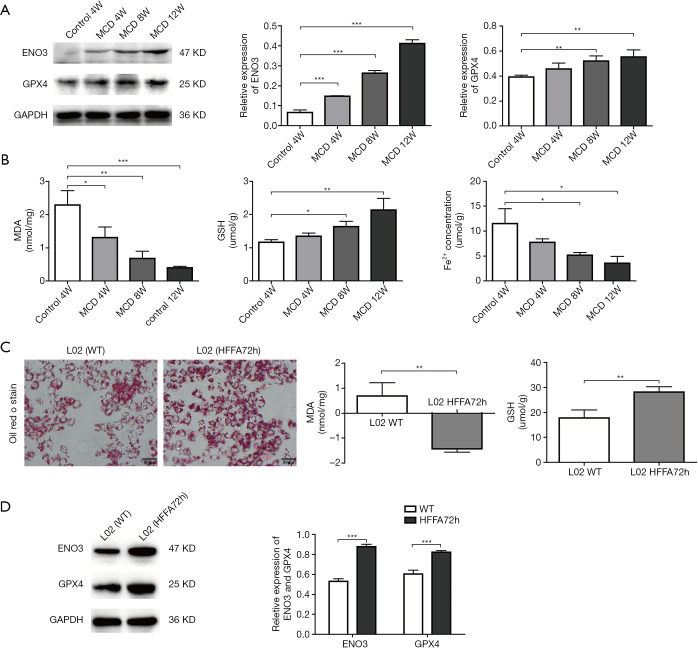
Figure 2.
Changes of ENO3, GPX4, and ferroptosis-related indicators in the NASH mice and cell models. (A) The protein expression of ENO3 and GPX4 in the liver tissue of the CDE diet model mice at 4, 8, and 12 weeks after CDE diet feeding was detected by western blotting and qRT-PCR, respectively; GAPDH was used as a control; (B) changes in MDA, GSH, and Fe2+ concentration in the liver tissue of the CDE diet model mice at 4, 8, and 12 weeks after CDE diet feeding; (C) oil red o staining was used to detect lipid accumulation and the levels of MDA and GSH in L02 cell lines after HFFA treatment for 72 hours; (D) the protein expression of ENO3 and GPX4 in the L02 cell line after HFFA treatment for 72 hours was detected by western blotting, and the relative expression of ENO3 and GPX4 was calculated by Image J. GAPDH was used as a control. Each set of samples was repeated three times. The data are shown as the mean ± standard deviation (n=6); *, P<0.05; **, P<0.01; ***, P<0.001, MCD group vs. Control group or HFFA 72 h group vs. WT group.

