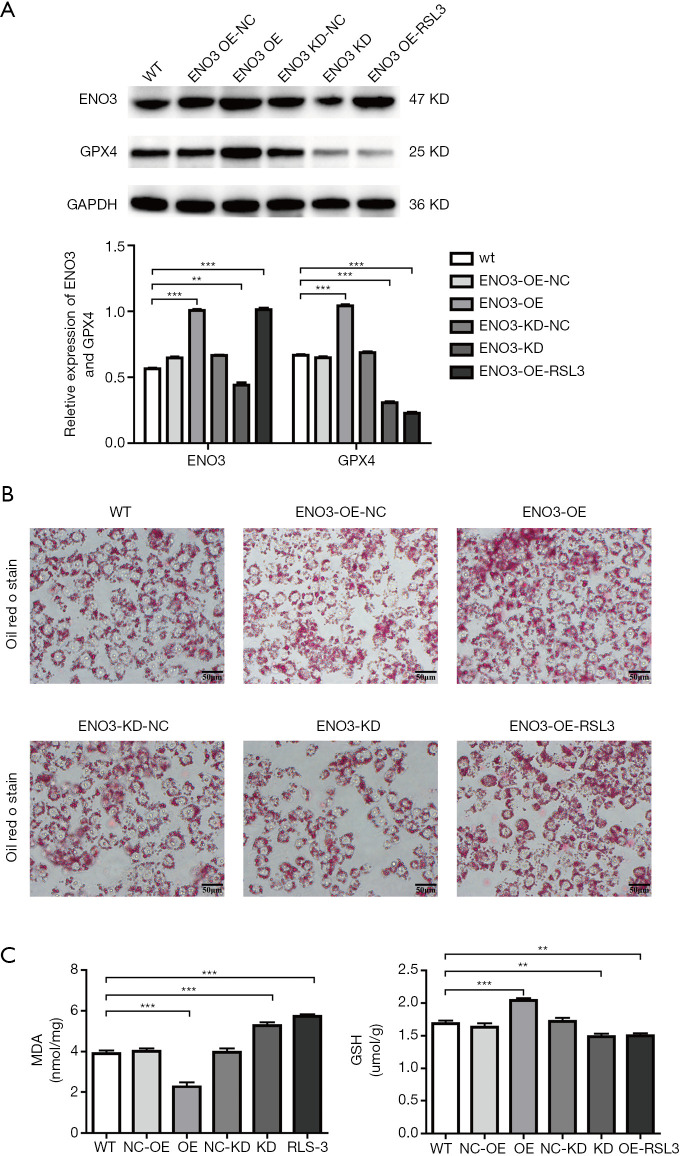
Figure 3.
ENO3 affected the lipid deposition and ferroptosis indicators in L02 cells. (A) The expression of ENO3 and GPX4 was detected by western blotting in the overexpressed/suppressed ENO3 L02 cells and in the overexpressed ENO3 L02 cells treated with RSL3. GAPDH was used as a control; (B) Oil red o staining was used to detect the lipid accumulation in the different groups; (C) the concentrations of MDA and GSH changed in the L02 cell lines in the different groups. Each set of samples was repeated three times. The data are shown as the mean ± standard deviation (n=6); **P<0.01; ***P<0.001, vs. WT group.

