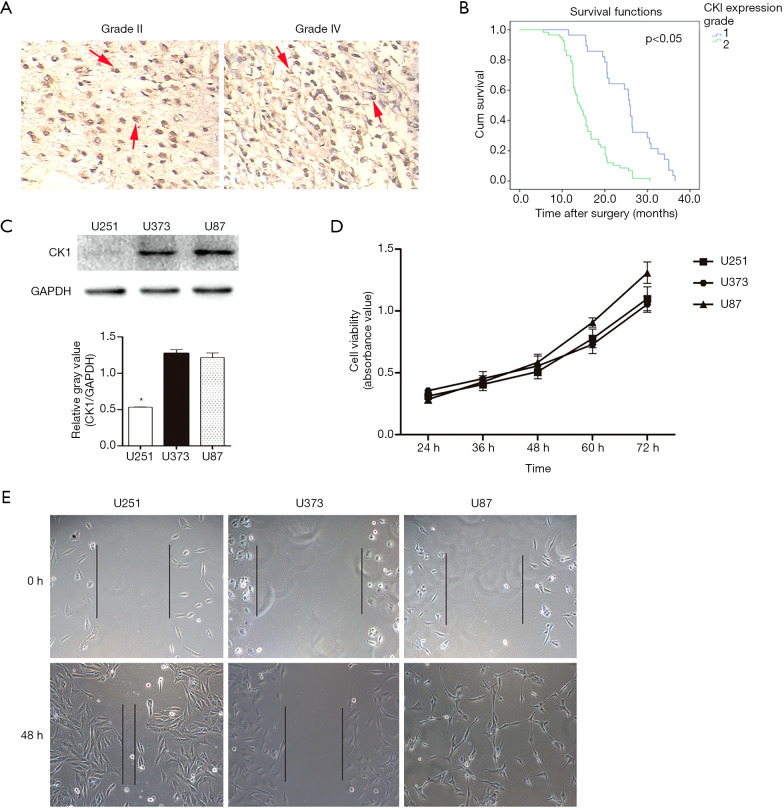
Figure 1.
Upregulation of CK1 was associated with poor prognosis and was involved in glioma cell behavior. (A) Representative images of CK1 staining by immunohistochemistry in tumor tissues from patients diagnosed with grade II and grade IV glioma (200×). The red arrow indicates a significant difference (P<0.05). (B) Kaplan-Meier survival curve for glioma patients stratified by low and high CK1 expression. (C) Representative western blots showing the expression levels of CK1 in U251, U373, and U87MG glioma cell lines. The gray value statistics graph is shown below. * indicates a significant difference (P<0.05). (D) Cell viability of glioma cell lines analyzed at 24, 36, 48, and 60 hours. (E) The wound closure ability of cell lines was analyzed in scratch experiments (200×).

