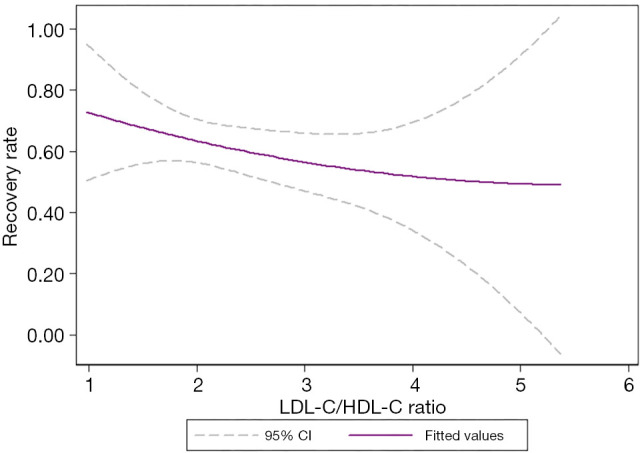
Figure 6.

Curve fitting showed that with the increase in the LDL-C/HDL-C ratio, the recovery rate decreased. The middle purple line represented the fitted values, and the upper and lower dashed lines represented the 95% confidence intervals. LDL-C/HDL-C ratio, the ratio between the levels of low-density lipoproteins and the levels of high-density lipoproteins.
