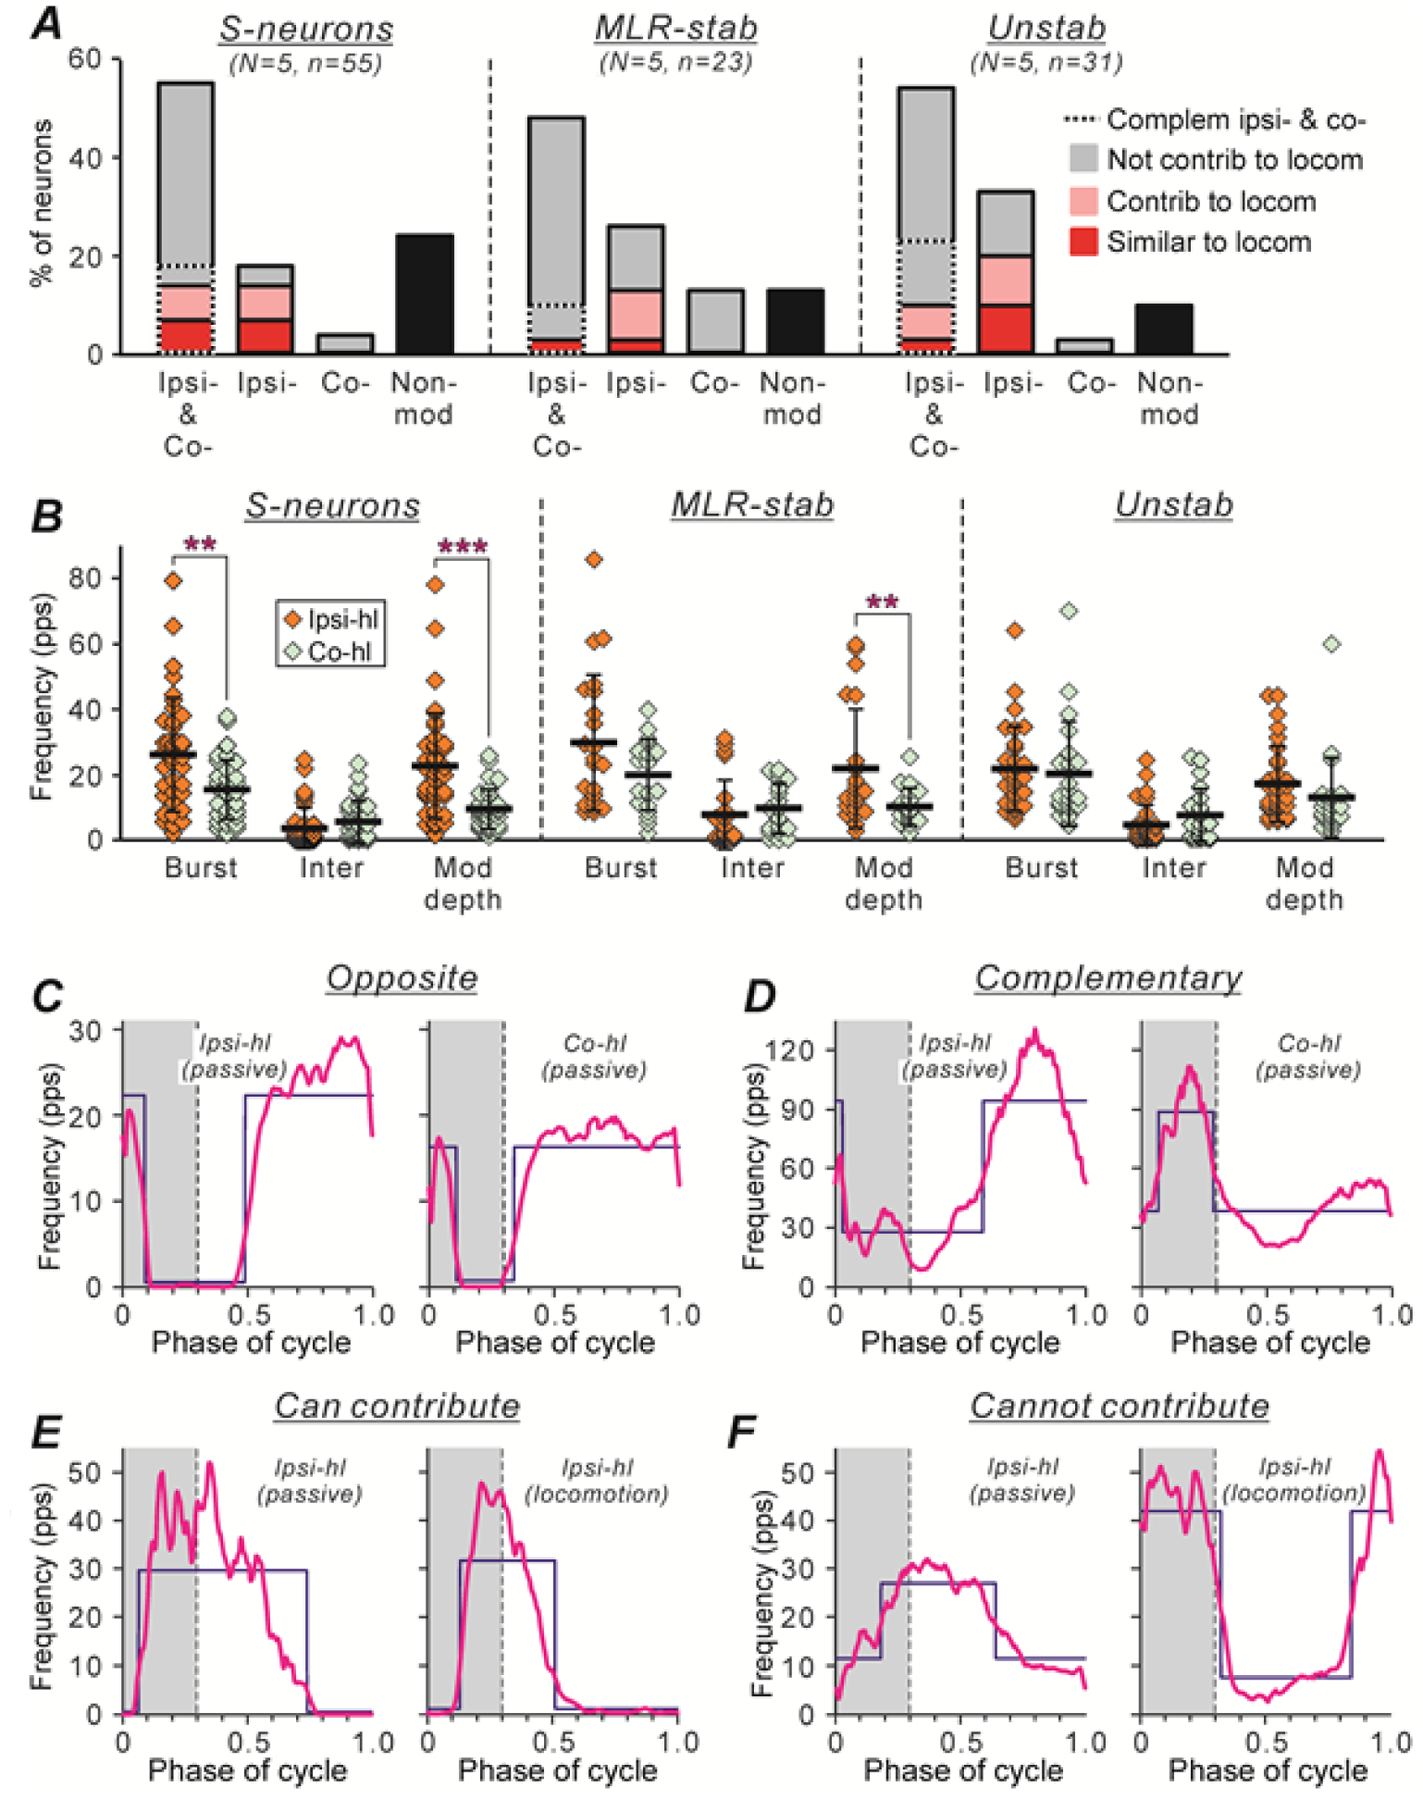
Figure 10. Effects of passive movements of the ipsilateral and of the contralateral hindlimb along the locomotor trajectory on activity of S-neurons, MLR-stable, and Unstable neurons.

A, Relative numbers of neurons modulated by passive movements of either hindlimb (Ipsi- & Co- bars), neurons modulated by movements of only ipsilateral or only contralateral limb (Ipsi- and Co- bars, respectively), and neurons non-modulated by passive limb movements (Non-mod bars), in populations of S-neurons, MLR-stable, and Unstable neurons. Parts of the Ipsi- & Co- bars with dotted and solid outlines show the proportions of neurons with complimentary and opposite inputs from ipsilateral and contralateral hindlimb (see Results for explanation), respectively. Red, pink, and gray parts of the bars indicate the proportion of neurons with the phase of modulation caused by sensory feedback similar to, strongly overlapping with, and different from that observed during locomotion (Similar to loc, Contrib to loc, and Cannot contrib to loc, respectively). Number of S-neurons, MLR-stable, and Unstable neurons recorded in 5 cats: n=55, 23, and 31, respectively. B, Mean ± SD values of the burst (Burst) and interburst (Inter) frequency, and the depth of modulation in S-neurons, MLR-stable, and Unstable neurons caused by passive movements of the ipsilateral limb (Ipsi-hl, N = 5, n = 39, 22, 31, respectively) and of the contralateral hindlimb (Co-hl, N = 5, n = 31, 19, 21, respectively) are indicated by black lines across corresponding clouds of diamonds showing the mean frequencies for individual neurons. Indication of significance level: ** 0.001 < p < 0.01, *** p < 0.001. C,D, Examples of two neurons with opposite (C) and complementary (D) sensory feedback from ipsilateral and contralateral hindlimbs. E,F, Examples of two neurons with sensory feedback from ipsilateral limb only, which can contribute (E) and cannot contribute (F) to locomotor modulation of the neuron. For each neuron, the histogram (thick line) of the activity of the neuron in the cycle of the ipsilateral hindlimb (Ipsi-hl) passive movements (left panels in C-F), and in the cycle of the contralateral hindlimb (Co-hl) passive movements (right panels in C,D) or in the cycle of the ipsilateral hindlimb locomotor movements (right panels in E,F) are shown. The swing phase is highlighted. The blue lines show the best two-level rectangular approximations of the histograms (as in Fig. 4A–L).
