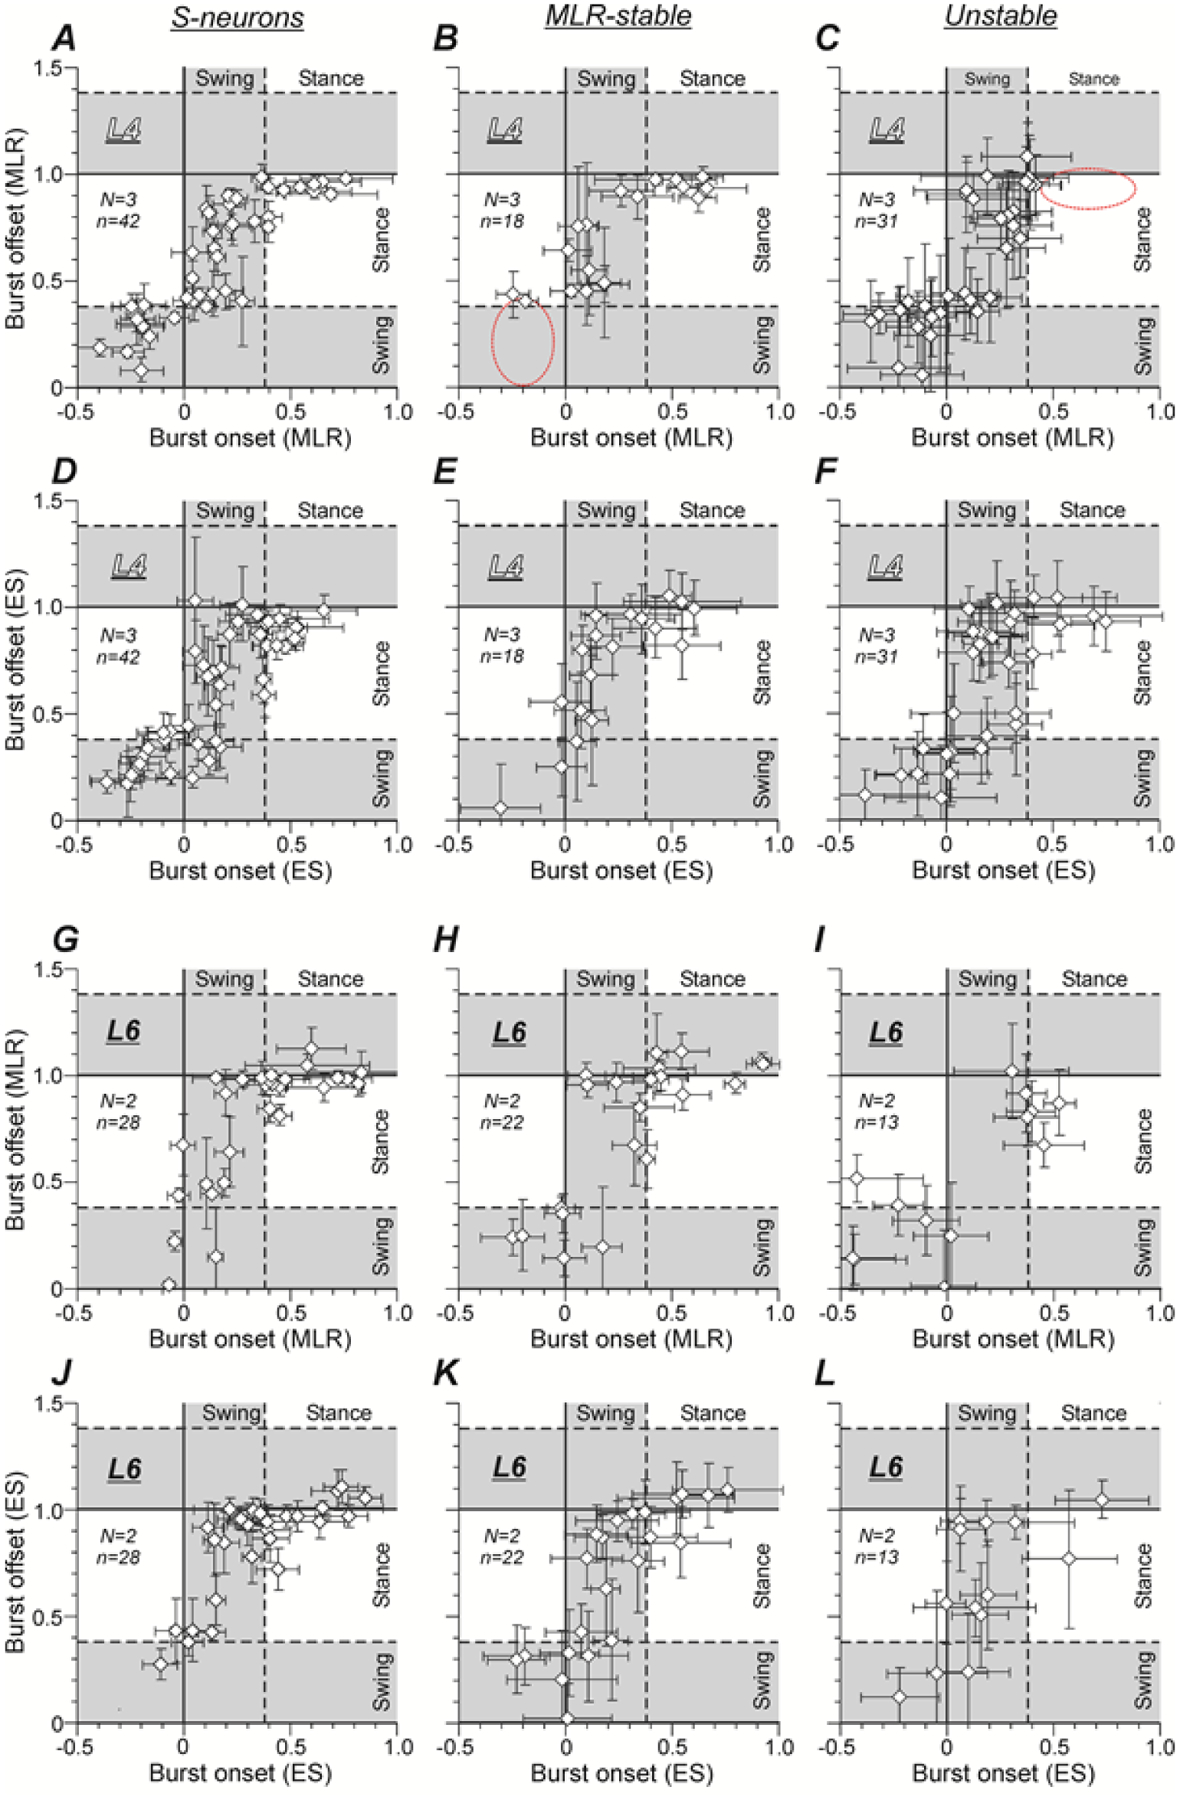
Figure 5. Phases of activity in the locomotor cycle of individual S-neurons, MLR-stable, and Unstable neurons during MLR- and ES-evoked locomotion.

A-L, Phase distribution of bursts of individual S-neurons (A,D,G,J), MLR-stable (B,E,H,K) and Unstable (C,F,I,L) neurons recorded in L4 (A-F) and L6 (G-L) in the cycle of MLR-evoked (A-C,G-I) and ES-evoked (D-F,J-L) locomotion. The x and y values of each point show the mean ± SD phases of the burst onset and the burst offset in the locomotor cycle, respectively. A dashed red ellipse deliniates a part of the locomotor cycle in which a subpopulation of S-neurons recorded in L4 had bursts of activity, but in a given population such subpopulation was absent. Number of animals and number of S-neurons, MLR-stable, Unstable neurons in A-F: N = 3 and n = 42, 18, 31, respectively. Number of animals and number of S-neurons, MLR-stable, Unstable neurons in G-L: N = 2 and n = 30, 22, 13, respectively.
