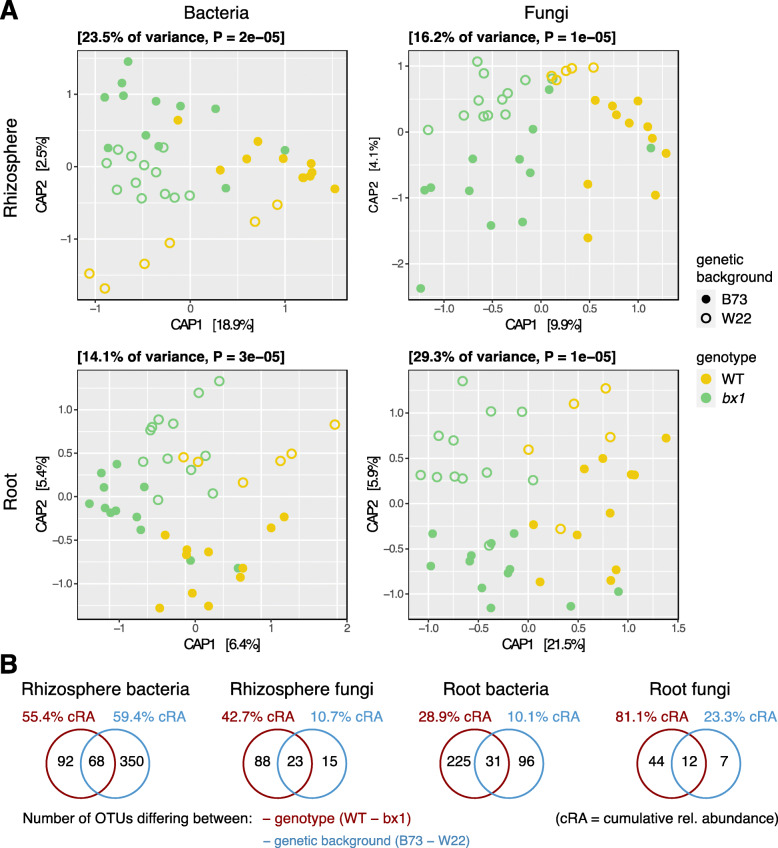
Fig. 3.
Microbiotas differ more by BX exudation than genetic background. Compartment-wise Constrained Analysis of Principal Coordinates (CAP) using Bray-Curtis distances of community profiles from bacteria (left) and fungi (right) and from rhizosphere (upper) and root compartment (down) from the Reckenholz experiment are shown in a. CAPs were performed using the model ‘~ genotype * genetic background. Genotypes of wild-type (yellow) and bx1 mutant (green) lines differ in color while the genetic backgrounds B73 (filled) and W22 (open) distinguish by symbol filling. b Number of OTUs that differed significantly by the two factors genotype (WT vs. bx1) or genetic background (B73 vs. W22) as determined by edgeR analysis (FDR < 0.05, Table S10). The % cRA represents the cumulated relative abundance of all detected differentially abundant b/fOTUs for the respective statistic contrast term

