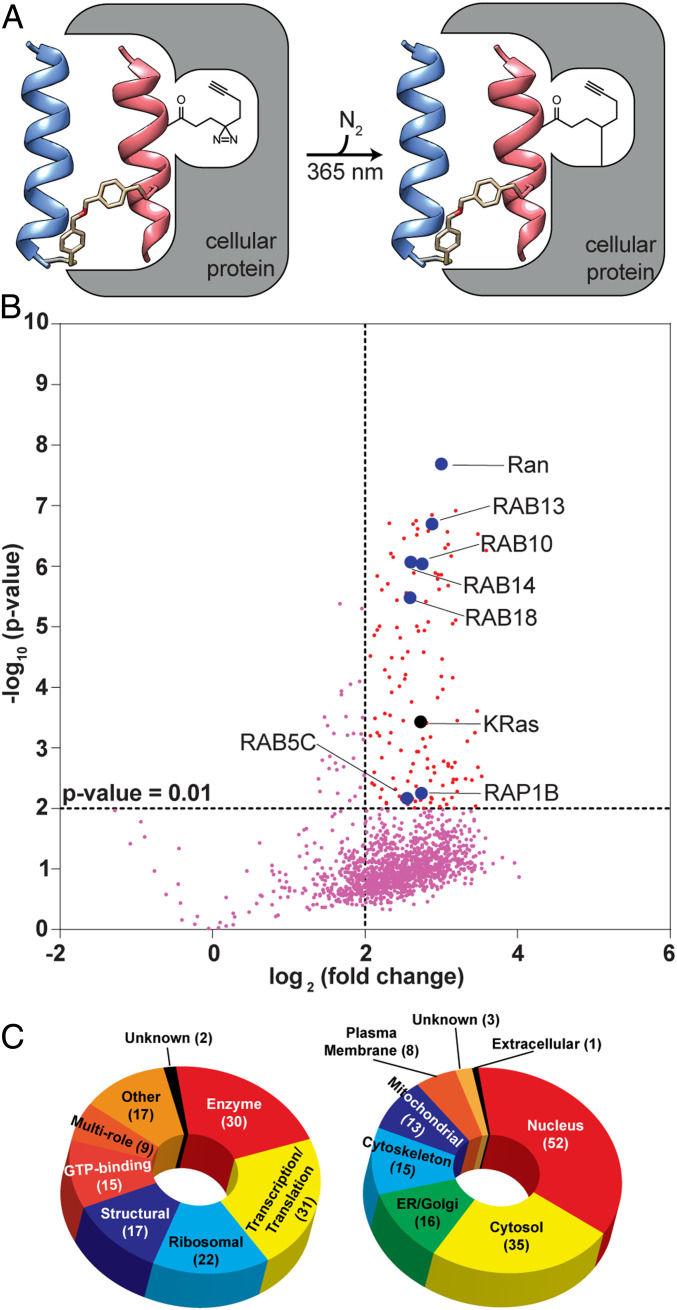
Fig. 5.
Analysis of Sos proteomimetic cellular interacting partners by quantitative MS-based proteomics. (A) Schematic depicting proximity-driven photocrosslinking of DZ2-CHDSos-5 with cellular proteins. (B) Volcano plot reveals statistically significant (P < 0.01) enriched proteins in H358 cells upon treatment with DZ2-CHDSos-5 (10 μM) for 4 h. Enriched protein targets that are members of the Ras GTPase superfamily are labeled. (C) Pie charts outlining functional diversity (Left) and cellular localization (Right) of the enriched protein targets.

