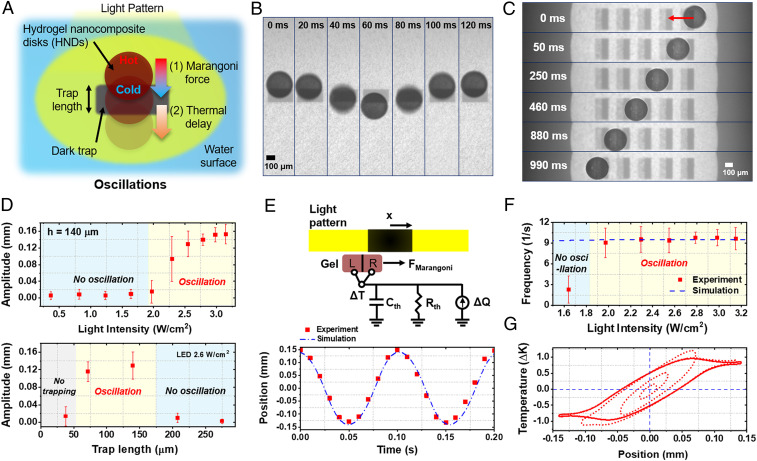
Fig. 1.
Oscillation of HNDs confined to Marangoni traps. (A) Schematic diagram of the trap geometry that drives oscillatory motion. (B) Time-lapse images of an HND undergoing oscillation within a symmetric trap. (C) Directed stochastic hopping along a row of asymmetric traps (Movie S1). (D) Amplitude of HND oscillations with varying light intensity and trap length. (E) Schematic diagram of the model (Top), and a comparison of experimental and simulated displacement for two cycles of oscillatory motion (Bottom). Light-emitting diode power = 2.8 W/cm2, trap length 140 μm. (F) Comparison between simulated and experimental frequencies with varying light intensity. (G) Simulated phase portrait of the oscillator showing position versus temperature difference.

