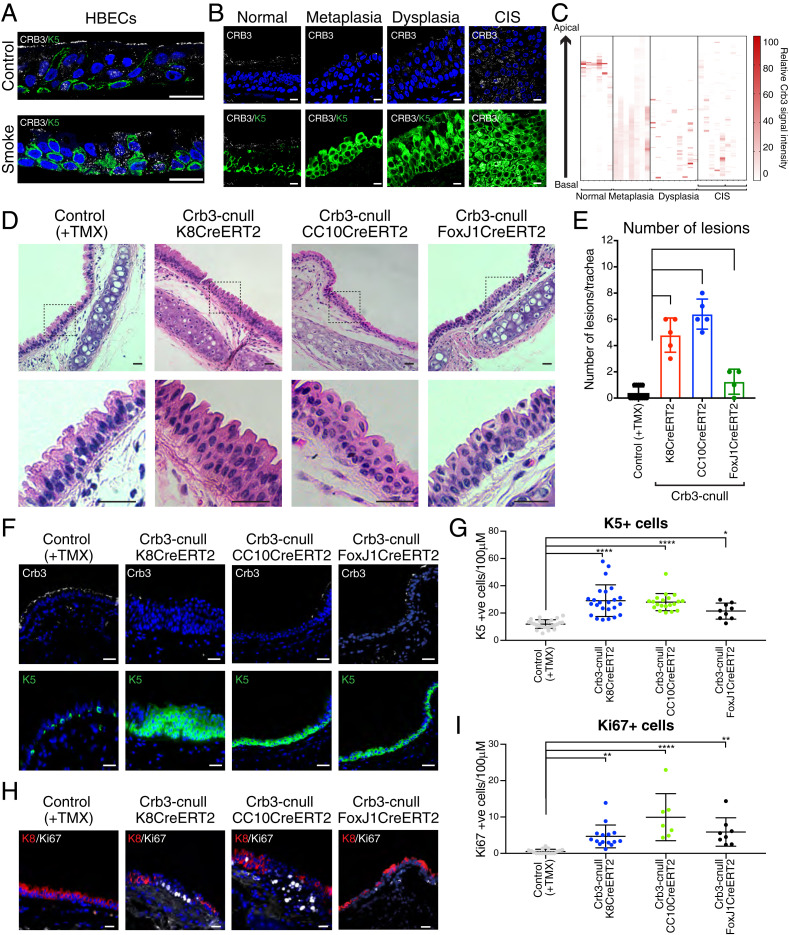
Fig. 1.
Loss of Crb3 in luminal airway epithelium results in the development of Krt5-positive lesions that resemble precancer pathology. (A) Primary HBECs were differentiated in ALI cultures and then exposed to a single dose of cigarette smoke (6.5% dose as described in Materials and Methods) or air as a control. The cells were fixed 4 h after exposure and then examined by IF microscopy for Crb3 and Krt5 levels and organization. Representative images from three independent samples per condition are shown. (B) CRB3 and KRT5 proteins were examined by IF microscopy in human bronchial brush biopsies with the indicated pathology, and (C) the pixel intensity for CRB3 was quantified across the apical–basal plane of the epithelium. Representative images are shown in B from normal (n = 6), metaplasia (n = 7), dysplasia (n = 8), and CIS (n = 2) pathologies that were quantified. Note that our CIS patient sample size was limited, and we therefore examined multiple different sections with CIS pathology across these patient samples. (D) Hematoxylin and eosin (H&E) staining was performed on trachea tissues isolated from the indicated conditional Crb3-deletion models 21 d post-tamoxifen (TMX) treatment. These models included targeting pan-luminal airway epithelial cells (Krt8CreERT2), secretory luminal airway epithelial cells (CC10CreERT2), and multiciliated luminal epithelial cells (FoxJ1CreERT2). Low magnification images are shown highlighting the positioning of the lesions near the cartilage rings, as well as higher magnification of stratified lesions outlined by the dotted black box. Representative images are shown from a minimum of three tissues across at least four mice. (E) The number of epithelial lesions that showed expansion and stratification of Krt5-positive cells were quantified across individual tracheas isolated from the indicated conditional Crb3-deletion models 21 d post-TMX treatment. Control (n = 14), K8CreERT2 (n = 5), CC10CreERT2 (n = 5), and FoxJ1CreERT2 (n = 4). (F) IF microscopy for Krt5 and Crb3 protein was performed on trachea tissues isolated from the indicated conditional Crb3-deletion models 21 d post-TMX treatment. (G) The number of Krt5-positive cells per 100 μM of tracheal epithelium was quantified within the respective conditional deletion models 21 d post-TMX treatment. Images from Control (n = 26), K8CreERT2 (n = 24), CC10CreERT2 (n = 25), and FoxJ1CreERT2 (n = 9) isolated from a minimum of four mice per condition were quantified. (H) Ki67-positive cells were identified by IF microscopy in the listed models of conditional Crb3 deletion 21 d post-TMX treatment. (l) The number of Ki67-positive cells per 100 μM within the trachea was quantified in the respective conditional deletion models 21-d post-TMX treatment. Images from Control (n = 17), Krt8CreERT2 (n = 15), CC10CreERT2 (n = 7), and FoxJ1CreERT2 (n = 9) isolated from a minimum of four mice per condition were quantified. Shown is the average ± SEM. Significance for all experiments in this figure was determined by the use of a Dunnett’s multiple comparisons test. ****P < 0.0001, **P < 0.01, and *P < 0.05. (Scale bar, 20 μm.)

