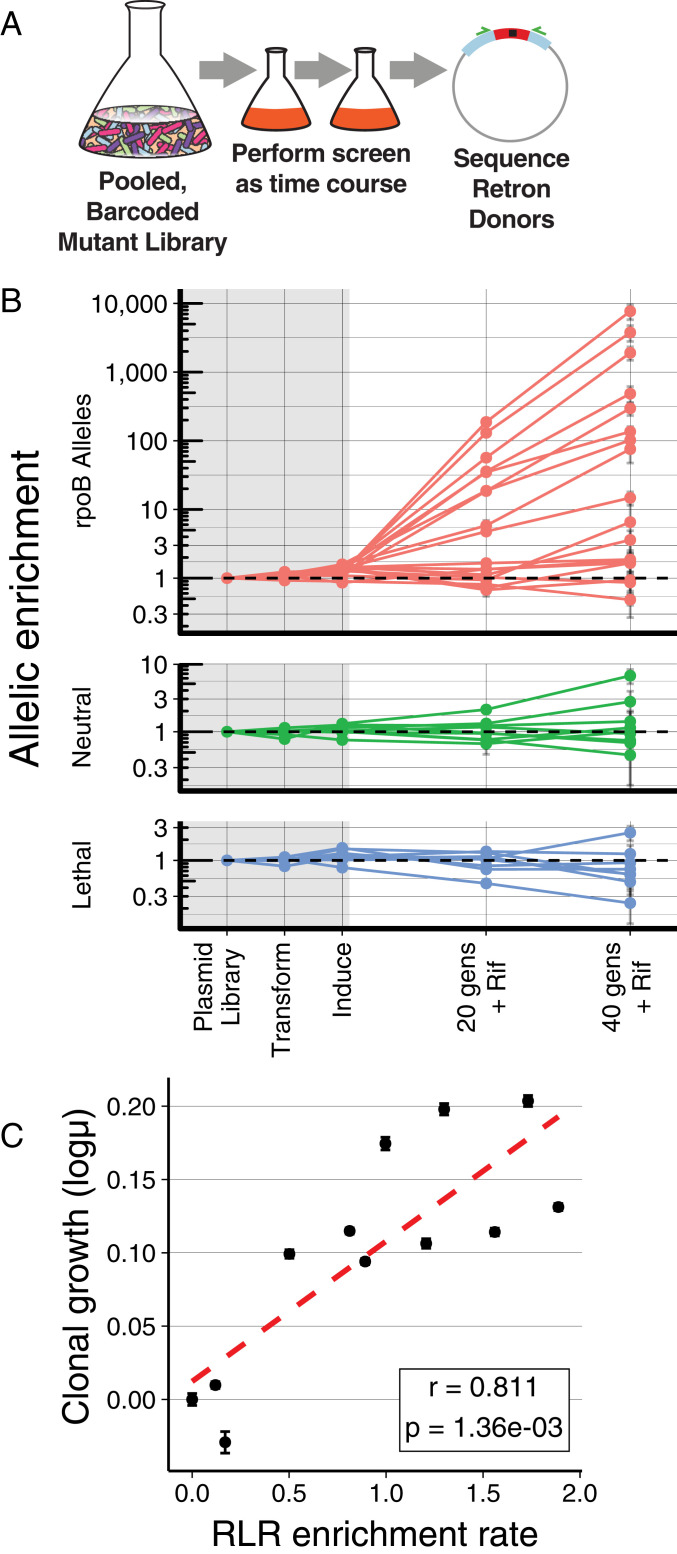
Fig. 4.
Quantitative measurements using RLR. (A) Graphical representation of quantitative RLR during a time course. The relative abundance of pooled, barcoded mutants is measured over time by NGS. (B) Relative abundance of donors during an experiment. Frequencies of each allele are normalized to the median of neutral controls within each time point, and to their starting abundance in the plasmid pool. Measurements within the gray rectangle occur during construction, transformation, and induction of the library, whereas those in the white area occur during growth in subinhibitory rifampicin (5 g/mL). The mean of three replicates is indicated with a dot; error bars are the standard error of the mean. Horizontal dashed lines indicate no change in frequency. (C) Growth rate of all mutants in the pool can be determined from the observed trajectories (RLR enrichment rate). Growth rate was measured individually for 11 resistance mutants using classical methods, and plotted against the log10 of RLR enrichment rate. Error bars depict standard error of these measurements; r is the Pearson’s correlation coefficient between these two measures, and the P is the probability of these results given the null hypothesis of no correlation.

