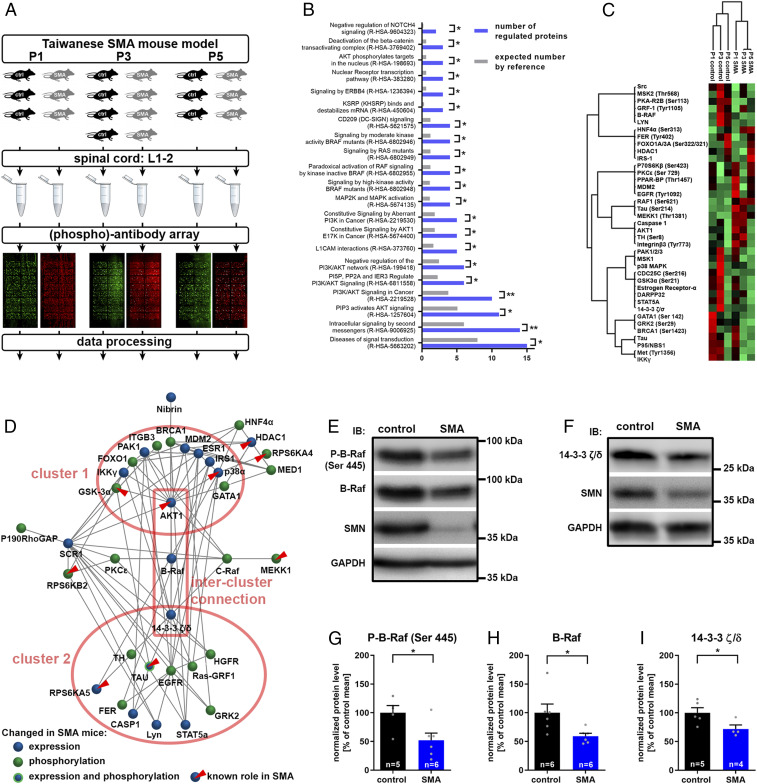
Fig. 1.
Systems biology of changed signaling in SMA and validation of critical signaling hubs. (A) Experimental setup for the screening of nonphosphoproteins and phosphoproteins in SMA. Taiwanese SMA mice (SMN−/−; hSMN2tg/0) and control littermates (SMN+/−; hSMN2tg/0) were dissected at the two presymptomatic time points P1 and P3 or at onset P5. Protein lysates of lumbar spinal cord segments 1 through 2 (L1-2) samples were prepared and analyzed on phospho explorer arrays for the quantification of phosphoprotein and total protein content of about 1,300 targets. (B) A list of the whole array targets served as a reference for the GO enrichment analysis in the set of dysregulated targets. The number of proteins with a reactome-pathway GO tag in the set of dysregulated proteins (blue bars) is compared to the expected number of proteins in the reference set (gray bars). The reactome-pathway identifier is given in parentheses. Fisher’s exact t test with *P ≤ 0.05 and **P ≤ 0.01. (C) A hierarchical cluster analysis was performed with normalized array intensities ranging from low intensities (red) to high intensities (green) constraint to a maximal number of 10 clusters. (D) Network analysis of altered (phospho)proteins in SMA mice which are connected by edges based on known interactions from the Biogrid database. The connectivity determined the topology of the network. Nodes which have been previously determined to be involved in SMA pathogenesis are highlighted (red triangles). (E and F) Representative Western blots of Th3-13 spinal cord segments from P5 control and SMA mice. (G–I) Western blots were densitometrically quantified, and the total amounts of (G) phospho-B-Raf (P-B-Raf), (H) B-Raf, and (I) 14-3-3 ζ/δ were calculated using glyceraldehyde 3-phosphate dehydrogenase for normalization. Bar graphs show mean + SEM with a Student’s t test P value given as *P ≤ 0.05.

