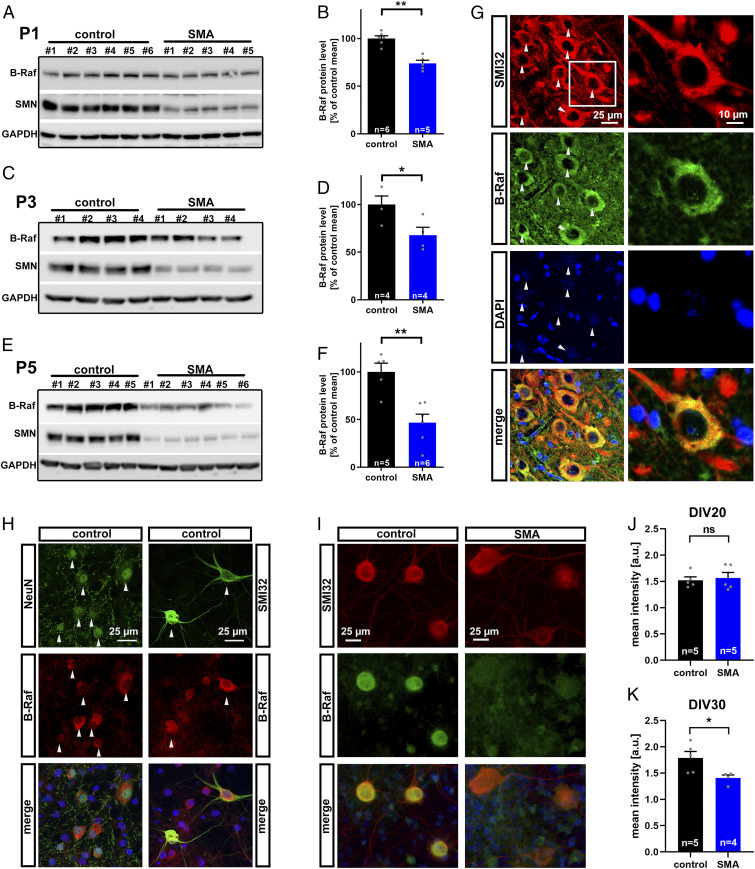
Fig. 2.
Time course of B-Raf reduction and its localization. (A–F) Western blots of lumbar L1-5 spinal cord segments including densitometric quantification of B-Raf expression. (A and B) Litters were prepared at presymptomatic P1 and (C and D) P3 as well as at (E and F) P5 at onset of the first symptoms. (G) Lumbar spinal cord sections of P5 mice were analyzed by immunohistochemistry using the motoneuron marker SMI32 which reveals motoneurons in the ventral spinal cord positive for B-Raf (arrowheads) while SMI32-negative cells express background levels only. Individual motoneurons display a granule B-Raf distribution at the perikaryon (Insets). (H) Confocal images of primary E12.5 spinal cord cultures stained for B-Raf, SMI32, and the neuronal marker NeuN (arrowheads). (I) Primary E12.5 spinal cord cultures from control and SMA embryos stained at day of in vitro 30 (DIV30) for B-Raf and SMI32. (J and K) The B-Raf immunofluorescence intensity was quantified in SMI32-positive motoneurons at (J) DIV20 and (K) DIV30. All bar graphs show mean + SEM with a Student’s t test P value indicated by *P ≤ 0.05 and **P ≤ 0.01 and ns (not significant).

