Fig. 3.
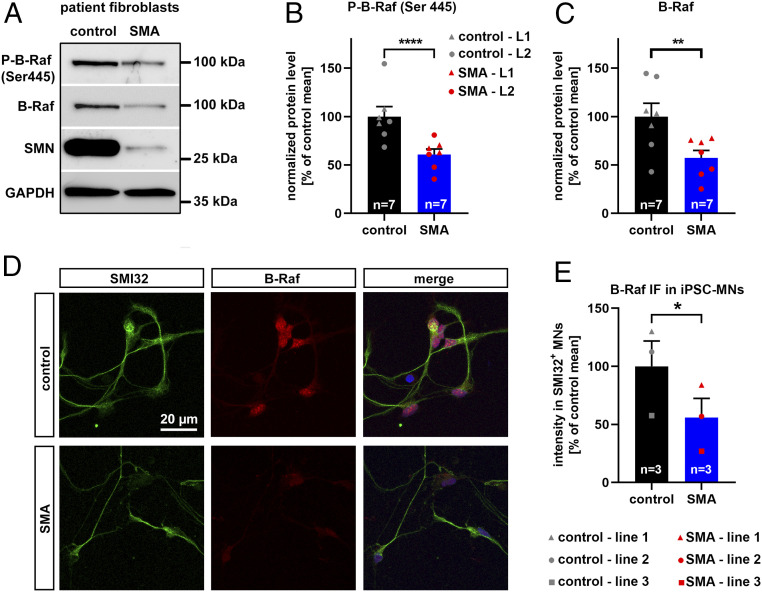
B-Raf expression in SMA patient cells. (A) Representative Western blot of primary fibroblasts from a SMA type I patient and a healthy control subject employing antibodies against phosphorylated B-Raf, total B-Raf, SMN, and GAPDH. (B) Densitometric quantification of the phospho-B-Raf and the (C) B-Raf signal both normalized by GAPDH. A SMA type I line (red dots) and a SMA type 0 line (red triangles) were used together with two different control lines. Biological independent passages were used in a paired experimental design. (D) Representative photomicrographs of iPSC-derived motoneurons identified by SMI32 immunopositivity. Motoneurons were generated from healthy control subjects and SMA type I patients and costained with B-Raf. (E) Three different control iPSC lines (gray data points) and three different SMA iPSC lines (red data points) were differentiated to motoneurons in a paired experimental setup with a control and SMA line treated in parallel each as a biological independent replicate (form of the data point). The B-Raf signal was quantified in SMI32-positive motoneurons. All bar graphs show mean + SEM with a paired-ratio Student’s t test P value indicated by *P ≤ 0.05, **P ≤ 0.01, and ****P ≤ 0.0001.

