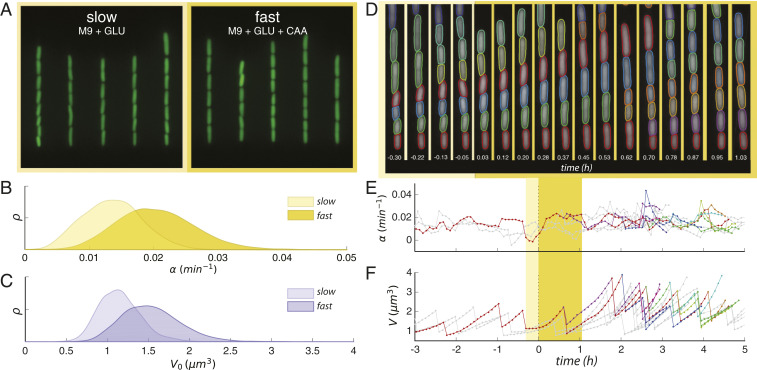
Fig. 1.
Robust and long-term single-cell tracking through a nutritional upshift. (A) Snapshots of trapped cells in microfluidic device under stringent (Left) and rich nutrient conditions (Right) (false-colored). (B) Steady-state distributions of growth rate in the two growth media. (C) Steady-state distributions of birth volumes for the sample populations in B. (D) Sample segmentation and tracking before and after the growth medium switch is implemented; time since switch is shown in hours. (E) Tracking the change of instantaneous growth rate following the switch for cells shown above. Yellow regions indicate time range spanned by segmented images; plotted line color corresponds to the cell above with the same color segmented boundary. (F) Volume tracking of the same cell lines. Interdivision time is identified as the interval between dramatic volume decreases.

