Fig. 2.
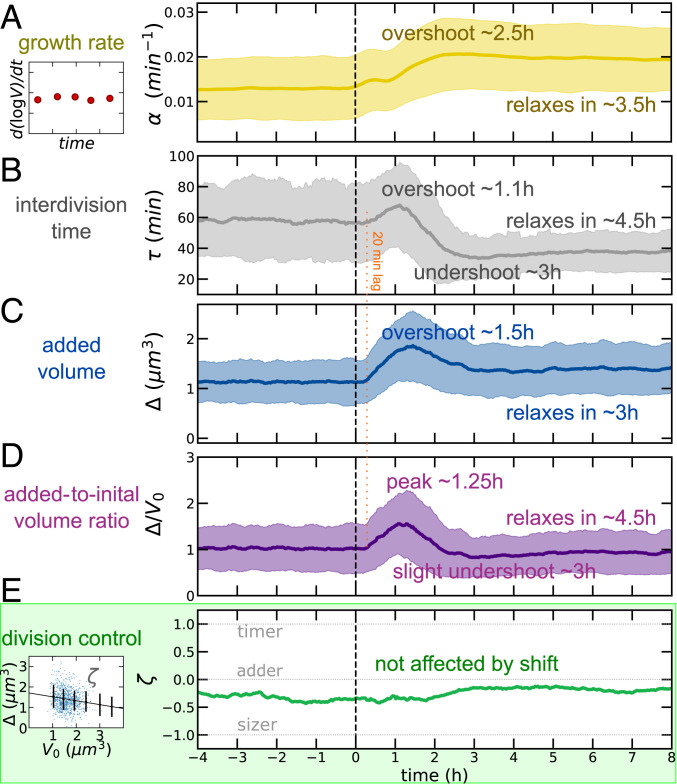
Near-adder behavior is conserved through a nutrient upshift, despite complex dynamics of growth and division processes. Medium shift is indicated at dotted vertical line. (A) Mean growth rate (defined by a derivative of single-cell growth curves, as illustrated by the sketch in Left) as a function of time in the experiment. The solid line indicates observable mean, and shaded regions indicate SD for all time series. (B) Interdivision time transiently increases before reaching its new (lower) steady value across the upshift. (C and D) Mean added volume shows an overshoot over more than 2 h after the shift; the mean ratio of added to initial size is one at steady states. (E) The division control shows near-adder behavior robustly across the shift. The adder plot (added size vs. initial cell size, as illustrated by the sketch on Left) quantifies division control by the slope (−1 for sizer, 1 for timer, and 0 for adder) (39). Data refer to averages over biological replicates using the P5ter promoter strain (Materials and Methods).

