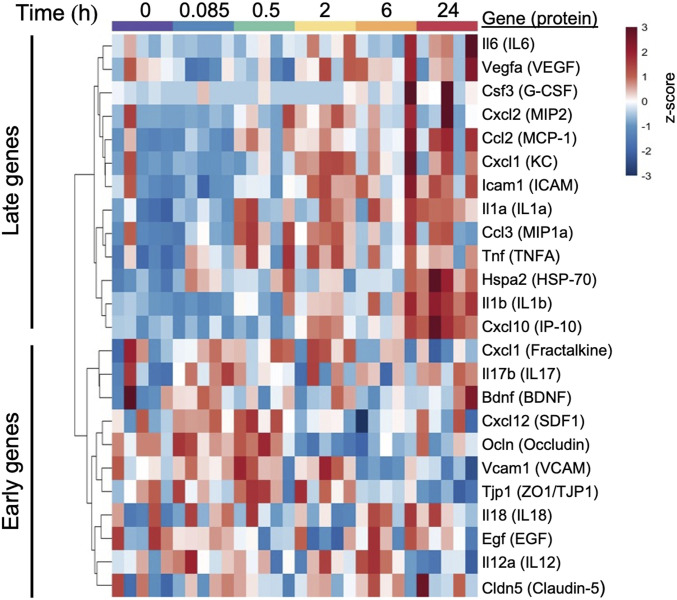
Fig. 3.
Changes in transcripts encoding key proteins from the protein array following ICAHM infusion. Heat map is shown with hierarchical clustering of transcripts (y-axis) from each sample collected 0.085, 0.5, 2, 6, and 24 h post-ICAHM and sham control samples (x-axis) (n = 5 rats per timepoint). Gene expression values were log2 transformed and z-score normalized by gene. Dendrogram was constructed using Euclidean distance measure with hierarchical cluster analysis by Ward’s method.

