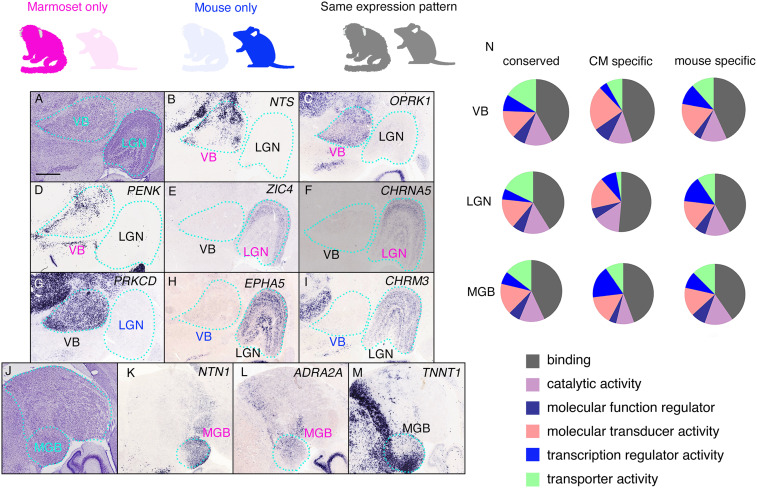
Fig. 3.
Gene-expression profiles in the thalamic nuclei. Three thalamic nuclei were selected, and their gene expression patterns were compared. Genes expressed in marmosets only, in mice only, and in both are indicated by magenta, blue, and black, respectively. (A) The Nissl reference atlas, showing the positions of the VB and LGN. (B–D) Marmoset- and VB-specific expression of NTS, OPRK1, and PENK. (E) Expression of PRKCD is specific to the marmoset VB. (E and F) ZIC4 and CHRNA5 display marmoset- and LGN-specific gene expression. (G) Expression of PRKCD is specific to the marmoset VB. (H and I) EPHA5 and CHRM3 are specifically expressed in the marmoset LGN. (J) The Nissl reference atlas showing the position of the MGB. (K and L) Marmoset- and MGB-specific expression of NTN1 and ADRA2A. (M) TNNT1 expression in the marmoset MGB with regional specification (medioventral strong). (N) GO analysis of the molecular functions of conserved and marmoset-specific genes. (Scale bar in A: 1 mm.)

