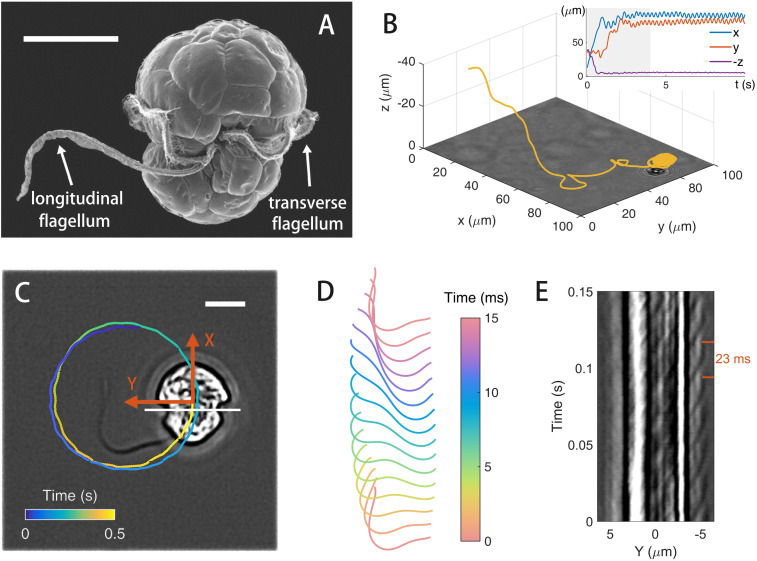
Fig. 1.
Cell motility and flagellar dynamics. (A) Scanning electron micrograph of E. voratum [reprinted with permission from ref. 41]. (B) A 3D trajectory of a cell approaching an air–liquid interface (at ) from the bulk. (Inset) Time history of cell coordinates in the laboratory frame (, , and ). (C) Circular trajectory plotted on an optical image of a cell at the interface. Undulations in the trajectory reflect beating phases of the longitudinal flagellum. A cell body frame (XY) is defined with X being the direction of body axis. (Scale bars in A and C, .) (D) Waveform of the longitudinal flagellum over a period. (E) Kymograph to show transverse flagellum dynamics. Intensity profiles of cell image are extracted along the white line (fixed in the cell body frame) in C. See Movies S1 and S2 for cell motion and flagellar dynamics.

