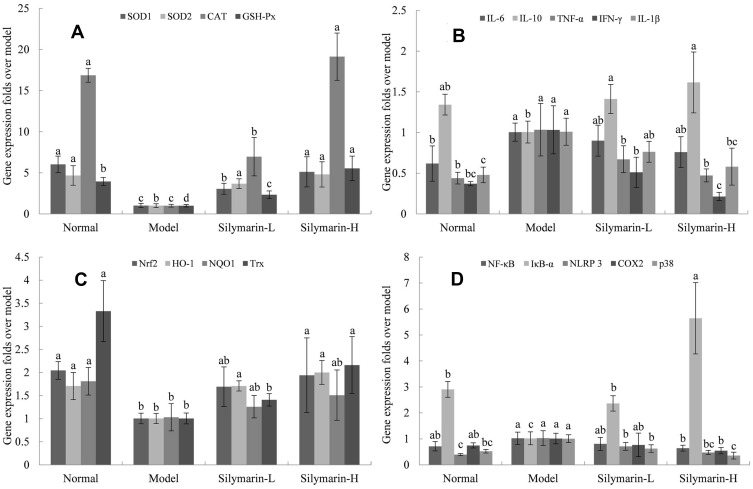
Figure 5.
mRNA expression in mice liver tissue with D-Gal/LPS-induced organ injury. (A) SOD1, SOD2, CAT and GSH-Px; (B) IL-6, IL-10, IL-1β, TNF-α and IFN-γ; (C) Nrf2, HO-1, NQO1 and Trx; (D) NF-κB, IκBα, NLRP3, COX2 and p38. Model: treated with D-Gal/LPS (30 mg/kg·bw/3 μg/kg·bw) intraperitoneal injection; silymarin-L: treated with silymarin (75 mg/kg·bw) intragastric administration; silymarin-H: treated with silymarin (150 mg/kg·bw) intragastric administration. a–dMean values with different letters in the same column are significantly different (p < 0.05) according to Tukey’s test.

