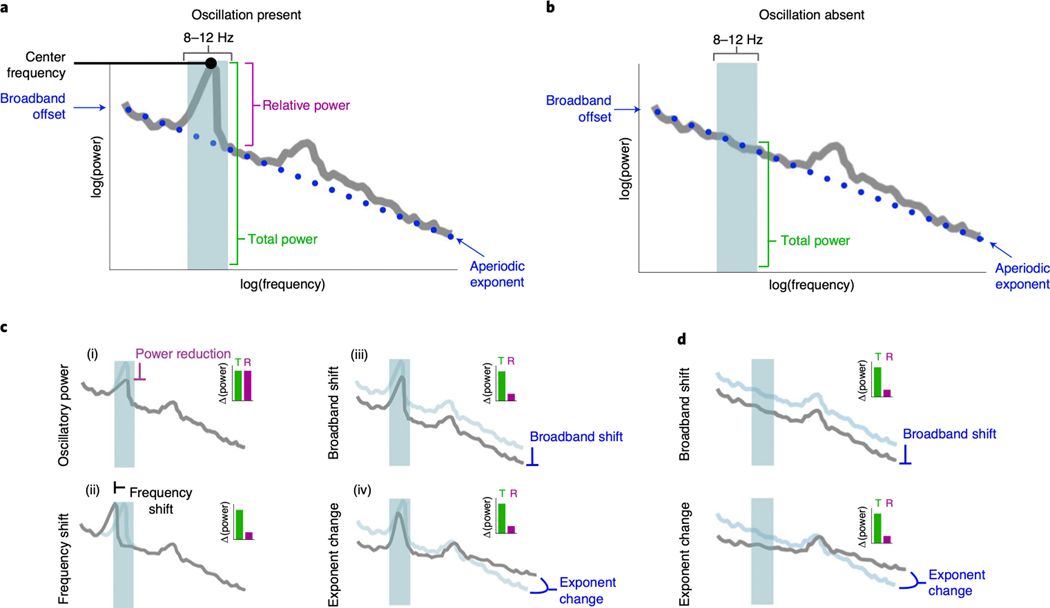
Figure 1 |. Overlapping nature of periodic and aperiodic spectral features.
(A) Example neural power spectrum with a strong alpha peak in the canonical frequency range (8–12 Hz, blue shaded region) and secondary beta peak (not marked). (B) Same as A, but with the alpha peak removed. (C-D) Apparent changes in a narrowband range (blue shaded region) can reflect several different physiological processes. Total power (green bars in the inset) reflects the total power in the range, and relative power (purple bars in the insets) reflect relative power of the peak, over and above the aperiodic component. (C) Measured changes, with a peak present, including: (i) oscillatory power reduction; (ii) oscillation center frequency shift; (iii) broadband power shift, or; (iv) aperiodic exponent change. In each simulated case, total measured narrowband power is similarly changed (inset, green bar), while only in the true power reduction case (i) has the 8–12 Hz oscillatory power relative to the aperiodic component actually changed (inset, purple bar). (D) Measured changes, with no peak present. This demonstrates how changes in the aperiodic component can be erroneously interpreted as changes in oscillation power when only focusing on a narrow band of interest.

