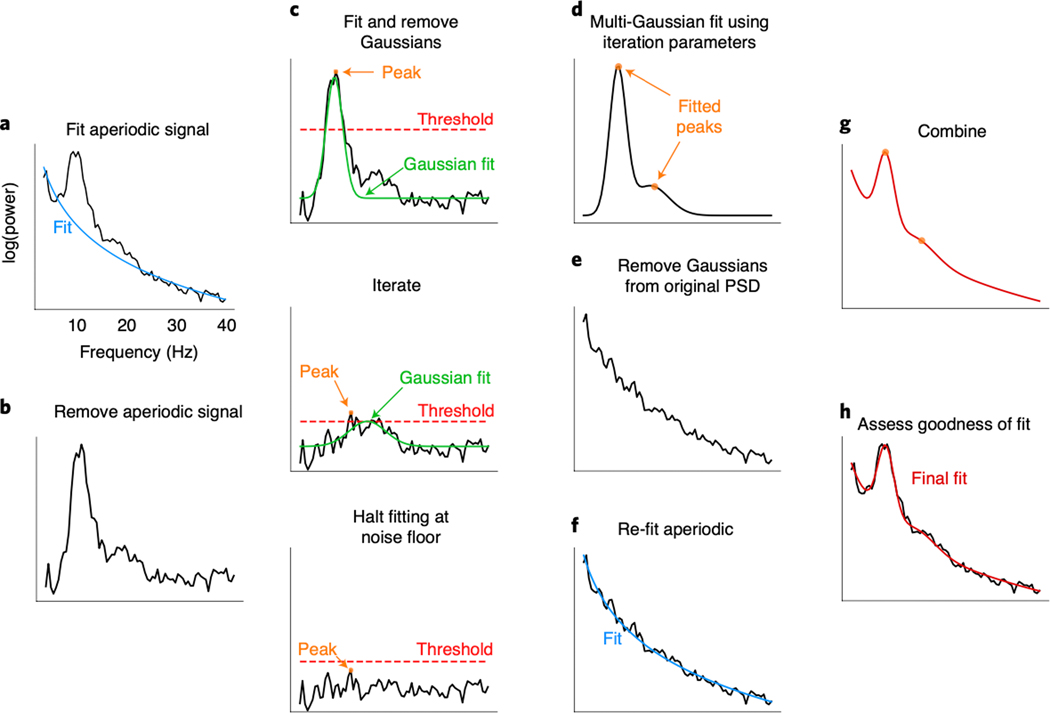
Figure 2 |. Algorithm schematic on real data.
(A) The power spectral density (PSD) is first fit with an estimated aperiodic component (blue). (B) The estimated aperiodic portion of the signal is subtracted from the raw PSD, the residuals of which are assumed to be a mix of periodic oscillatory peaks and noise. (C) The maximum (peak) of the residuals is found (orange). If this peak is above the noise threshold (dashed red line), calculated from the standard deviation of the residuals, then a Gaussian (solid green line) is fit around this peak based on the peak’s frequency, power, and estimated bandwidth (see Methods). The fitted Gaussian is then subtracted, and the process is iterated until the next identified point falls below a noise threshold or the maximum number of peaks is reached. The peak-finding at this step is only used for seeding the multi-Gaussian in D, and, as such, the output in D can be different from the peaks detected at this step. (D) Having identified the number of putative oscillations, based on the number of peaks above the noise threshold, multi-Gaussian fitting is then performed on the aperiodic-adjusted signal from B to account for the joint power contributed by all the putative oscillations, together. In this example, two Gaussians are fit with slightly shifted peaks (orange dots) from the peaks identified in C. (E) This multi-Gaussian model is then subtracted from the original PSD from A. (F) A new fit for the aperiodic component is estimated—one that is less corrupted by the large oscillations present in the original PSD (blue). (G) This re-fit aperiodic component is combined with the multi-Gaussian model to give the final fit. (H) The final fit (red)—here parameterized as an aperiodic component and two Gaussians (putative oscillations)—captures >99% of the variance of the original PSD. In this example, the extracted parameters for the aperiodic component are: broadband offset = −21.4 au; exponent = 1.12 au/Hz. Two Gaussians were found, with the parameters: (1) frequency = 10.0 Hz, power = 0.69 au, bandwidth = 3.18 Hz; (2) frequency = 16.3 Hz, power = 0.14 au, bandwidth = 7.03 Hz.

