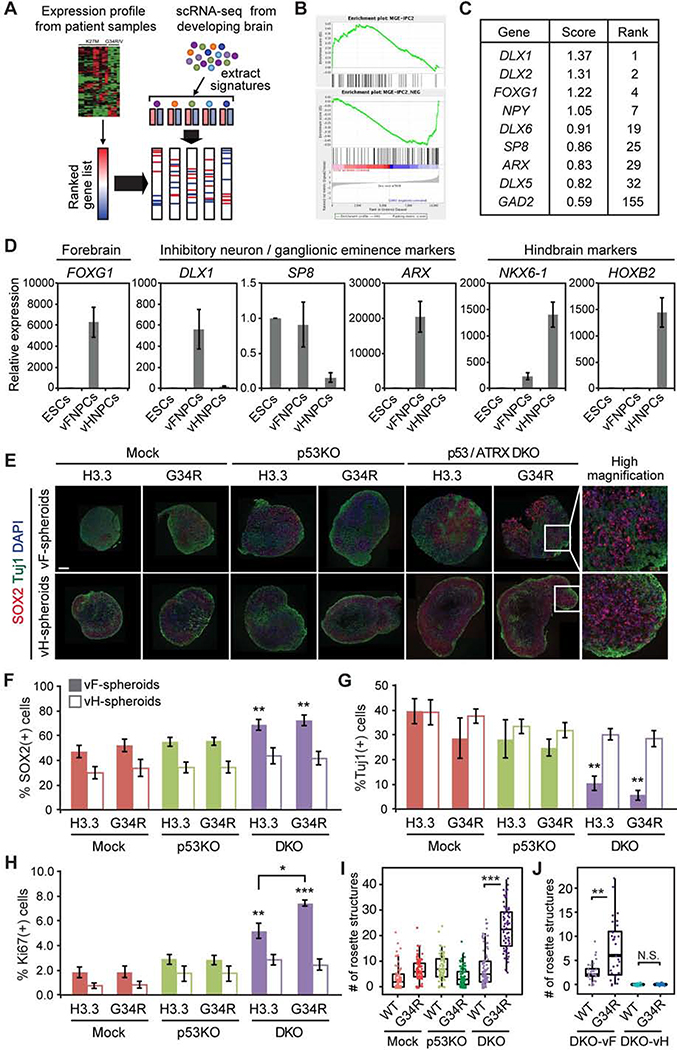
Figure 1. Development of hESC-based model of H3.3G34R-mutant HGG.
(A) Schematic illustration of expression profile analysis.
(B) Representative GSEA plots show enrichment of interneuronal expression signature in H3.3G34R mutant tumors compared to H3K27M mutant tumors. MGE-IPC2: Medial Ganglionic Eminence - Intermediate Progenitor Cell - Cluster 2 (see methods).
(C) Table shows a list of genes specifically expressed in H3.3G34R/V-mutant HGG.
(D) Lineage-specific expression of marker genes in ventral forebrain neural progenitor cells (vFNPCs) and in ventral hindbrain neural progenitor cells (vHNPCs) was validated by RT-qPCR. Values are normalized to those of H1 embryonic stem cells (ESCs). Bars indicate mean ± S.E.M. (n = 3–4).
(E) Composite immunohistochemistry images of frozen sections of neural spheroids from each condition show an incremental increase of SOX2-positive NPCs and decrease of ßIII-tubulin (TUJl)-positive neurons by the combination of mutations. Scale bar, 20 μm.
(F-H) Intracellular flow cytometry shows an increase of SOX2-positive NPCs (F), a decrease of TUJl-positive neurons (G), and an increase in the Ki-67 proliferation index (H) by the combination of mutations, in ventral forebrain cultures but not in ventral hindbrain cultures. Bars indicate mean ± S.E.M. (n = 3–6).
(I) Box plot shows the number of rosette structures per spheroid in ventral forebrain cultures. More than 50 spheroids were analyzed for each condition.
(J) Combination of mutations increased the number of rosette structures per spheroid in DKO ventral forebrain (vF) cultures, but not in DKO ventral hindbrain (vH) cultures. (n = 28–32) P values were calculated by two-sided Welch’s t-test (F-H) or Wilcoxon rank-sum test (I and J). *P < 0.05, **P < 0.01, ***P < 0.001, NS, Not Significant.

