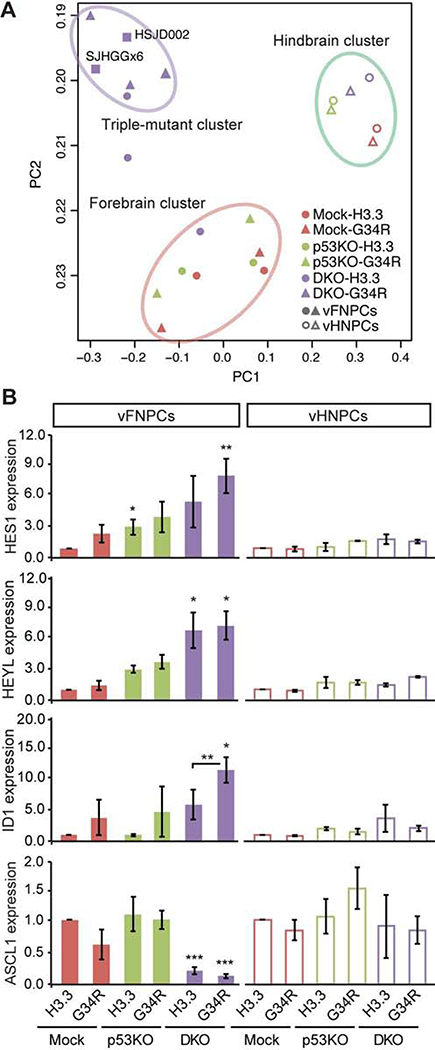
Figure 3. H3.3G34R and co-occurring mutations alter gene expression profile.
(A) Principal component analysis of RNA-seq data shows a distinct expression profile of DKO-G34R cells, which are clustered together with H3.3G34R-mutant patient-derived cell lines (SJHGGx6 and HSJD002) (upper left). Hindbrain cells form a separate cluster regardless of mutation status (upper right).
(B) RT-qPCR confirms the altered expression of the indicated genes by the combination of mutations in vFNPCs, but not in vHNPCs (n = 3–5).
P values were calculated by two-sided Welch’s t test. *P < 0.05, **P < 0.01, ***P < 0.001.

