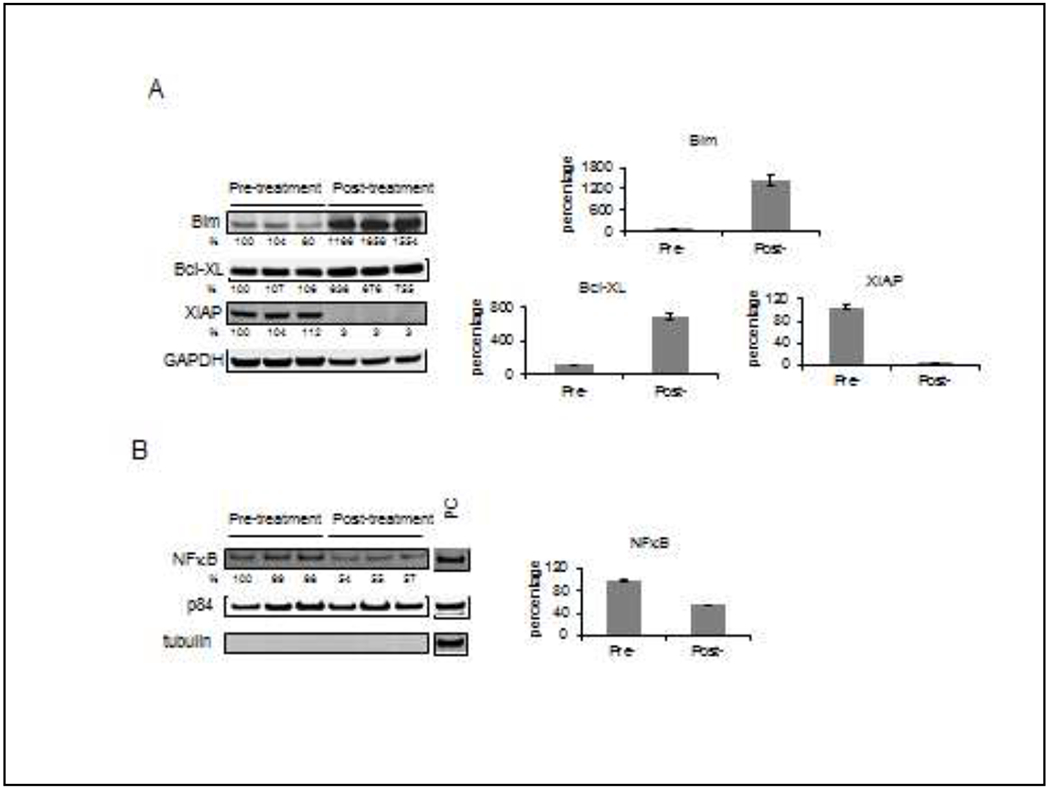
Figure 1.

Western blot analysis of pre- and post-treatment patient peripheral blood samples PBMCs were isolated at baseline (pre-) and 24 hours after (post-) treatment. A, triplicate whole cell lysate samples were run and analyzed for their level of expression of Bim, Bcl-XL, and XIAP. The numbers below the figures represent the relative level of the assayed proteins normalized to the GAPDH level, where the normalized level of first pre-treatment sample is defined as 100%. The graphs show the relative level of assayed proteins in the samples (average ± standard error). B, nuclear extracts from the samples were analyzed for NF-κB. The numbers below the NF-κB figure represent the relative level of the assayed protein normalized to the p84 level, where the normalized level of the first pre-treatment sample is defined as 100%. To show the purity of nuclear fraction, α-tubulin was run as a Marker of cytoplasmic contamination. PC: positive control sample. The graph shows the relative level of assayed proteins in the samples (average ± standard error).
