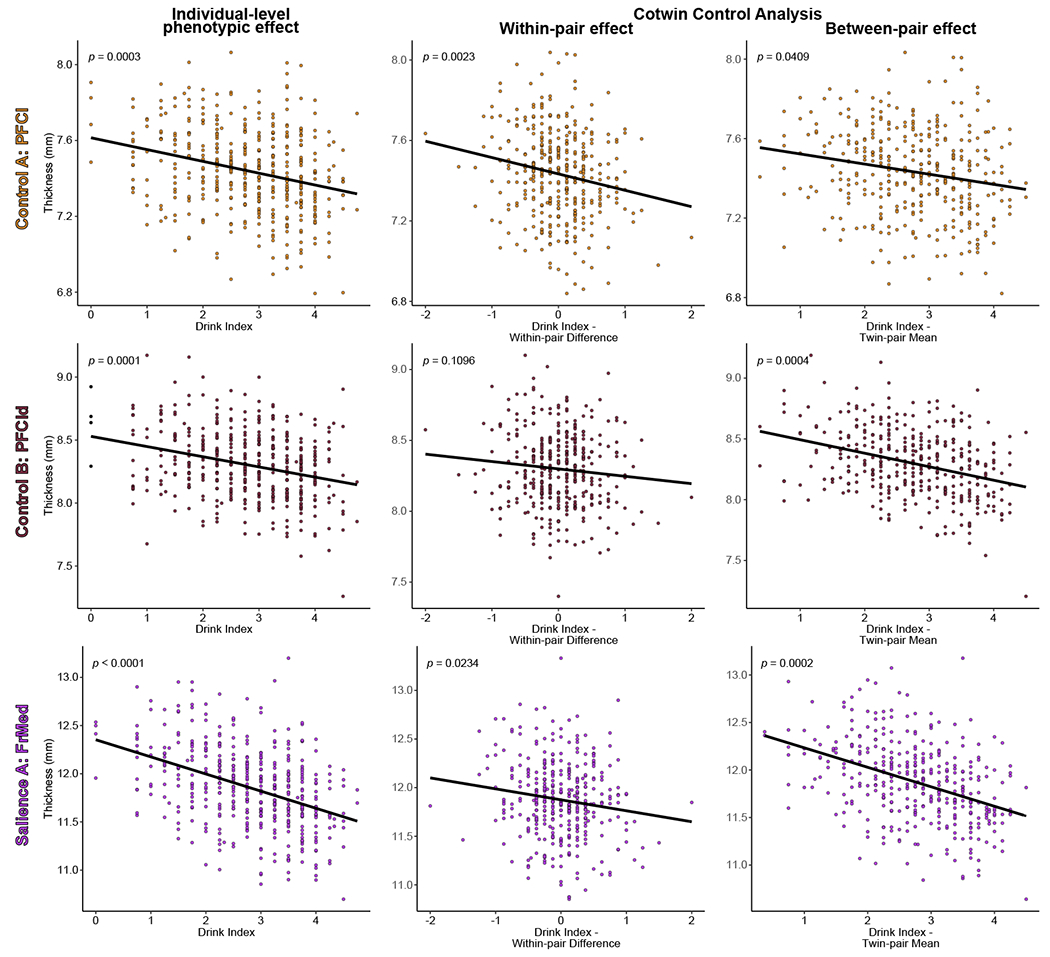
Figure 3.

Partial residual plots of alcohol use and cortical thickness for three illustrative cortical areas. The individual-level phenotypic effects (i.e., without regard to twin-pair membership, analogous to a standard regression of outcome on exposure) and cotwin control analysis within-pair and between-pair effects are depicted along with model fit lines and p-values from the linear mixed models of drink index scores on cortical thickness (adjusting for all covariates). For the within-pair effects, the model fit lines illustrate that heavier-drinking twins (positive within-pair difference scores) exhibited significantly reduced thickness of the lateral prefrontal and frontal medial, but not dorsolateral prefrontal, cortices relative to their lesser-drinking cotwins (negative within-pair difference scores), consistent with an exposure effect (after accounting for all familial confounding; see Methods). For the between-pair scores, model fit lines illustrate the significant relationship between cortical thickness of all three areas and the mean level of alcohol use within a twin pair (twin-pair mean score), consistent with a premorbid familial risk effect. The visreg R package (83) was used to create the figure. Abbreviations: PFCl, lateral prefrontal cortex; PFCld; dorsolateral prefrontal cortex; FrMed, frontal medial cortex.
