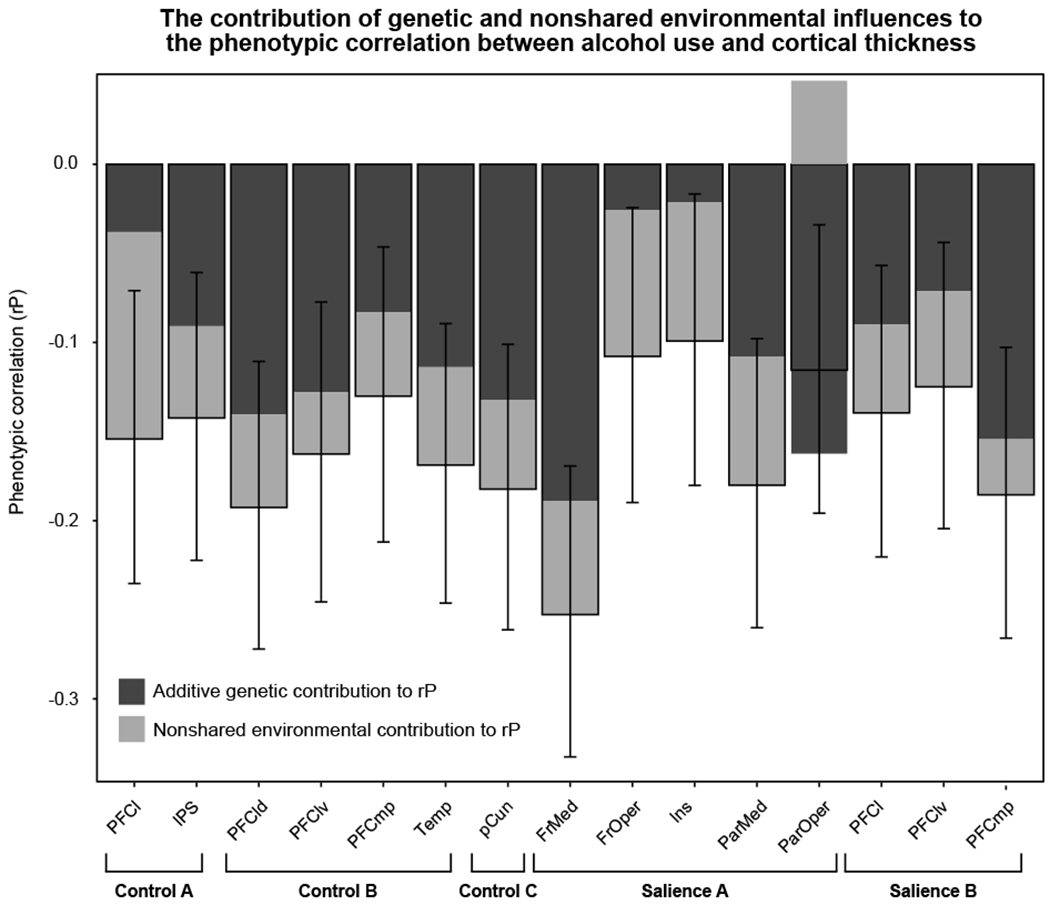
Figure 4.

Bar graph of the biometric model-implied phenotypic correlations between drink index scores and cortical thickness. Bars are filled according to the relative contribution of genetic (dark grey) and nonshared environmental influences (light grey) to the phenotypic correlation. See Supplemental Section S7 and Table S7 for details. Whiskers depict likelihood-based 90% confidence intervals corresponding to one-tailed, α = 0.05 hypothesis tests given expectations set by the individual-level phenotypic linear mixed model results of negative phenotypic correlations between alcohol use and thickness. Note that for the parietal operculum, because the genetic and nonshared environmental influences were in opposing directions (as were the between-pair and within-pair cotwin control effects), their relative contributions to the phenotypic correlation are also in opposing directions but still sum to the phenotypic correlation. Abbreviations: PFC, prefrontal cortex; IPS, intraparietal sulcus; Temp, temporal; pCun; precuneus; FrMed, frontal medial; FrOper, frontal operculum; Ins, insula; ParMed, parietal medial; ParOper, parietal operculum; l, lateral; d, dorsal; v, ventral; mp, medial posterior.
