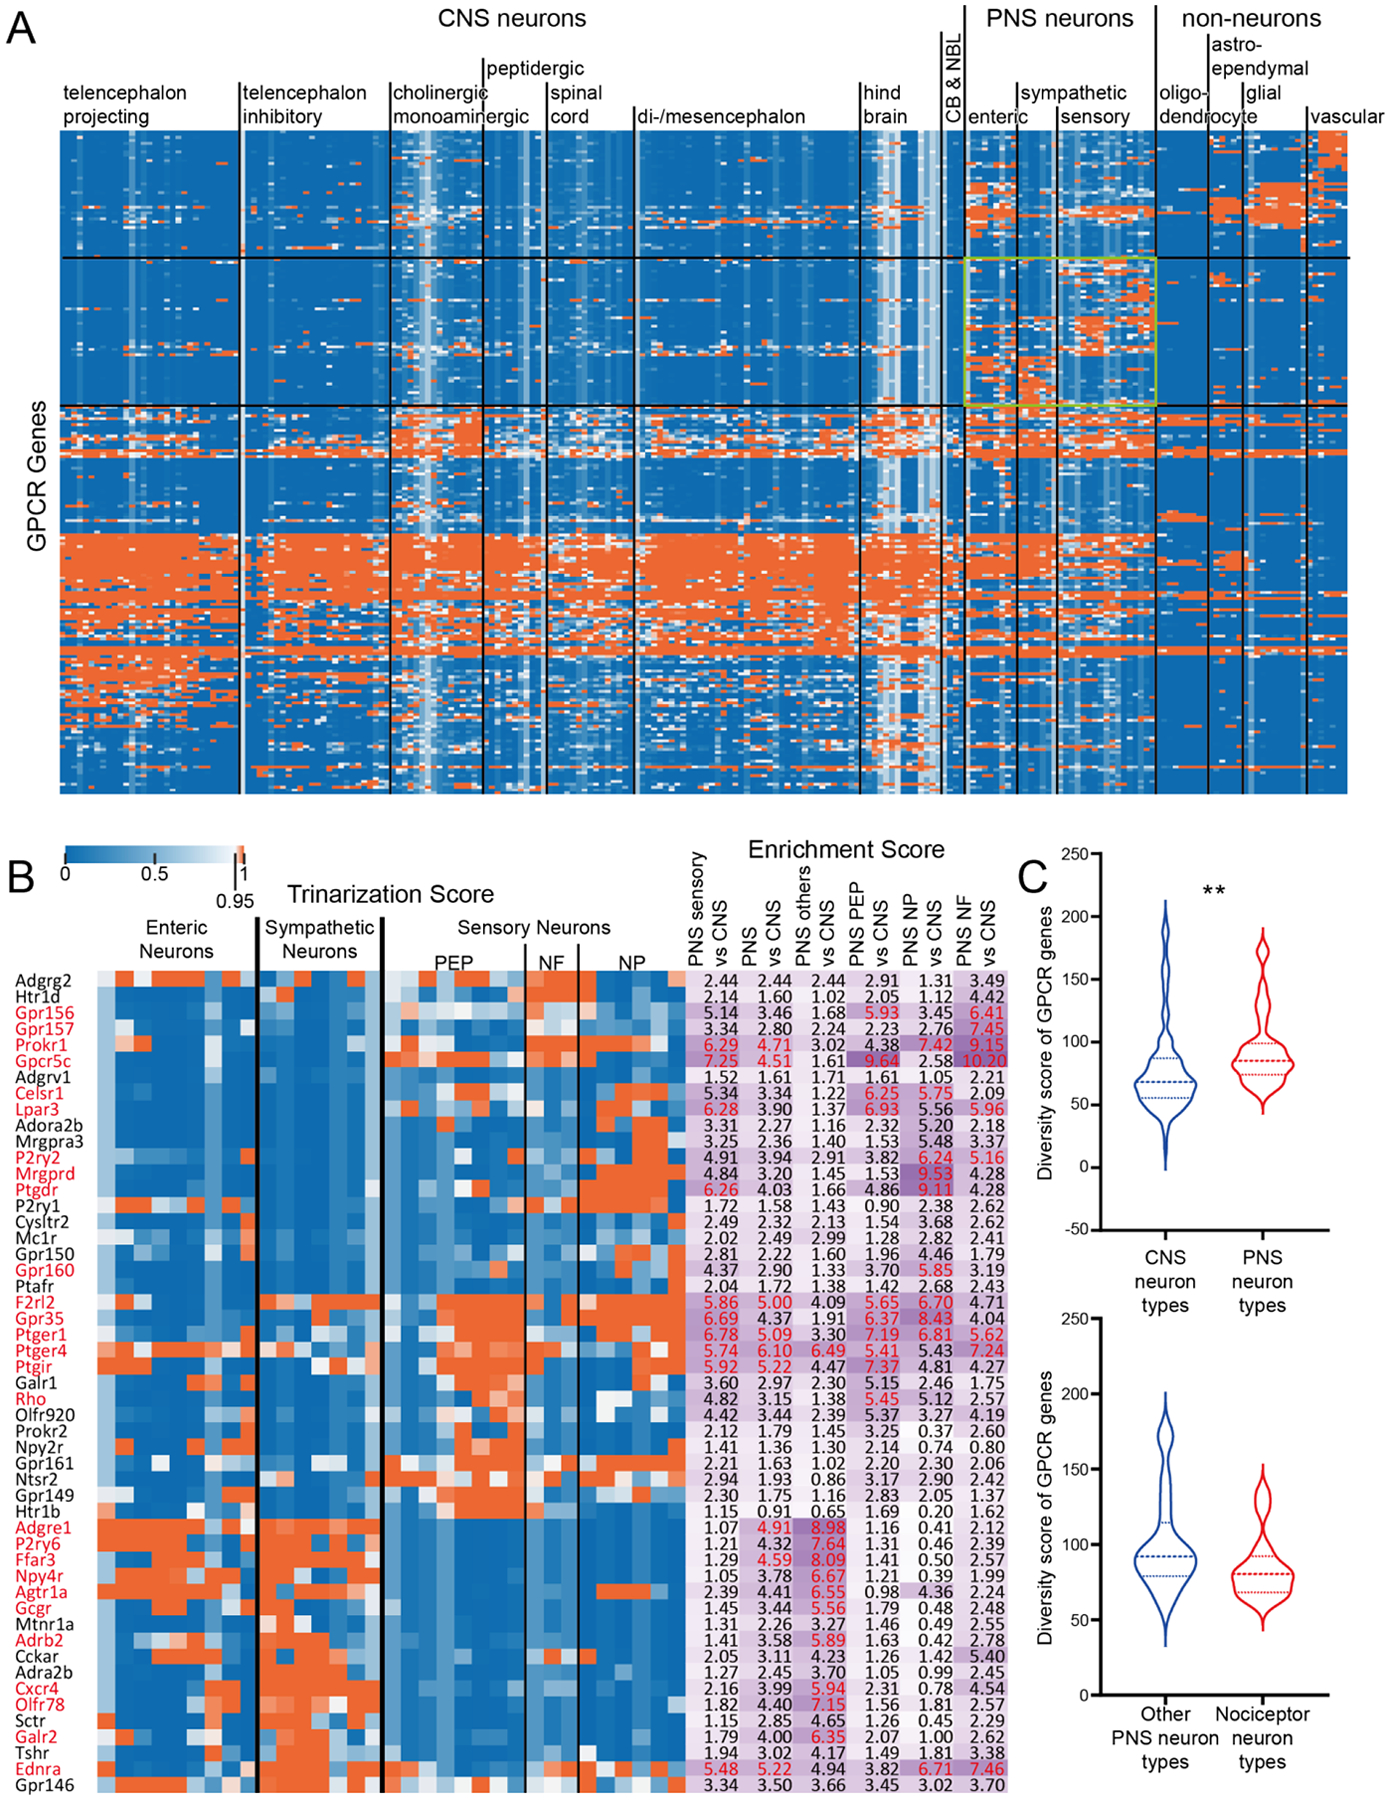
Figure 1. GPCR diversity between CNS and PNS neurons.

A) Hierarchical clustering of all GPCR genes based on their trinarization score across all CNS and PNS cell-types. Green box highlights the GPCR genes enriched in PNS neurons. B) Detailed gene names and trinarization score across PNS neuron subtypes, and enrichment score for genes enriched in PNS neurons. Enrichment scores > 95th percentile in the corresponding column are highlighted in red, along with the gene name. C) Violin plot showing the distribution of GPCR diversity scores for all CNS neuron types comparing with PNS neuron types. Welch’s t-test returns a p-value of 0.0073 indicating PNS neurons have greater GPCR diversity comparing with CNS neurons. D) Violin plot showing the distribution of GPCR diversity score for all non-nociceptor PNS neuron types comparing with nociceptors. Welch’s t-test returns a p-value of 0.0972.
