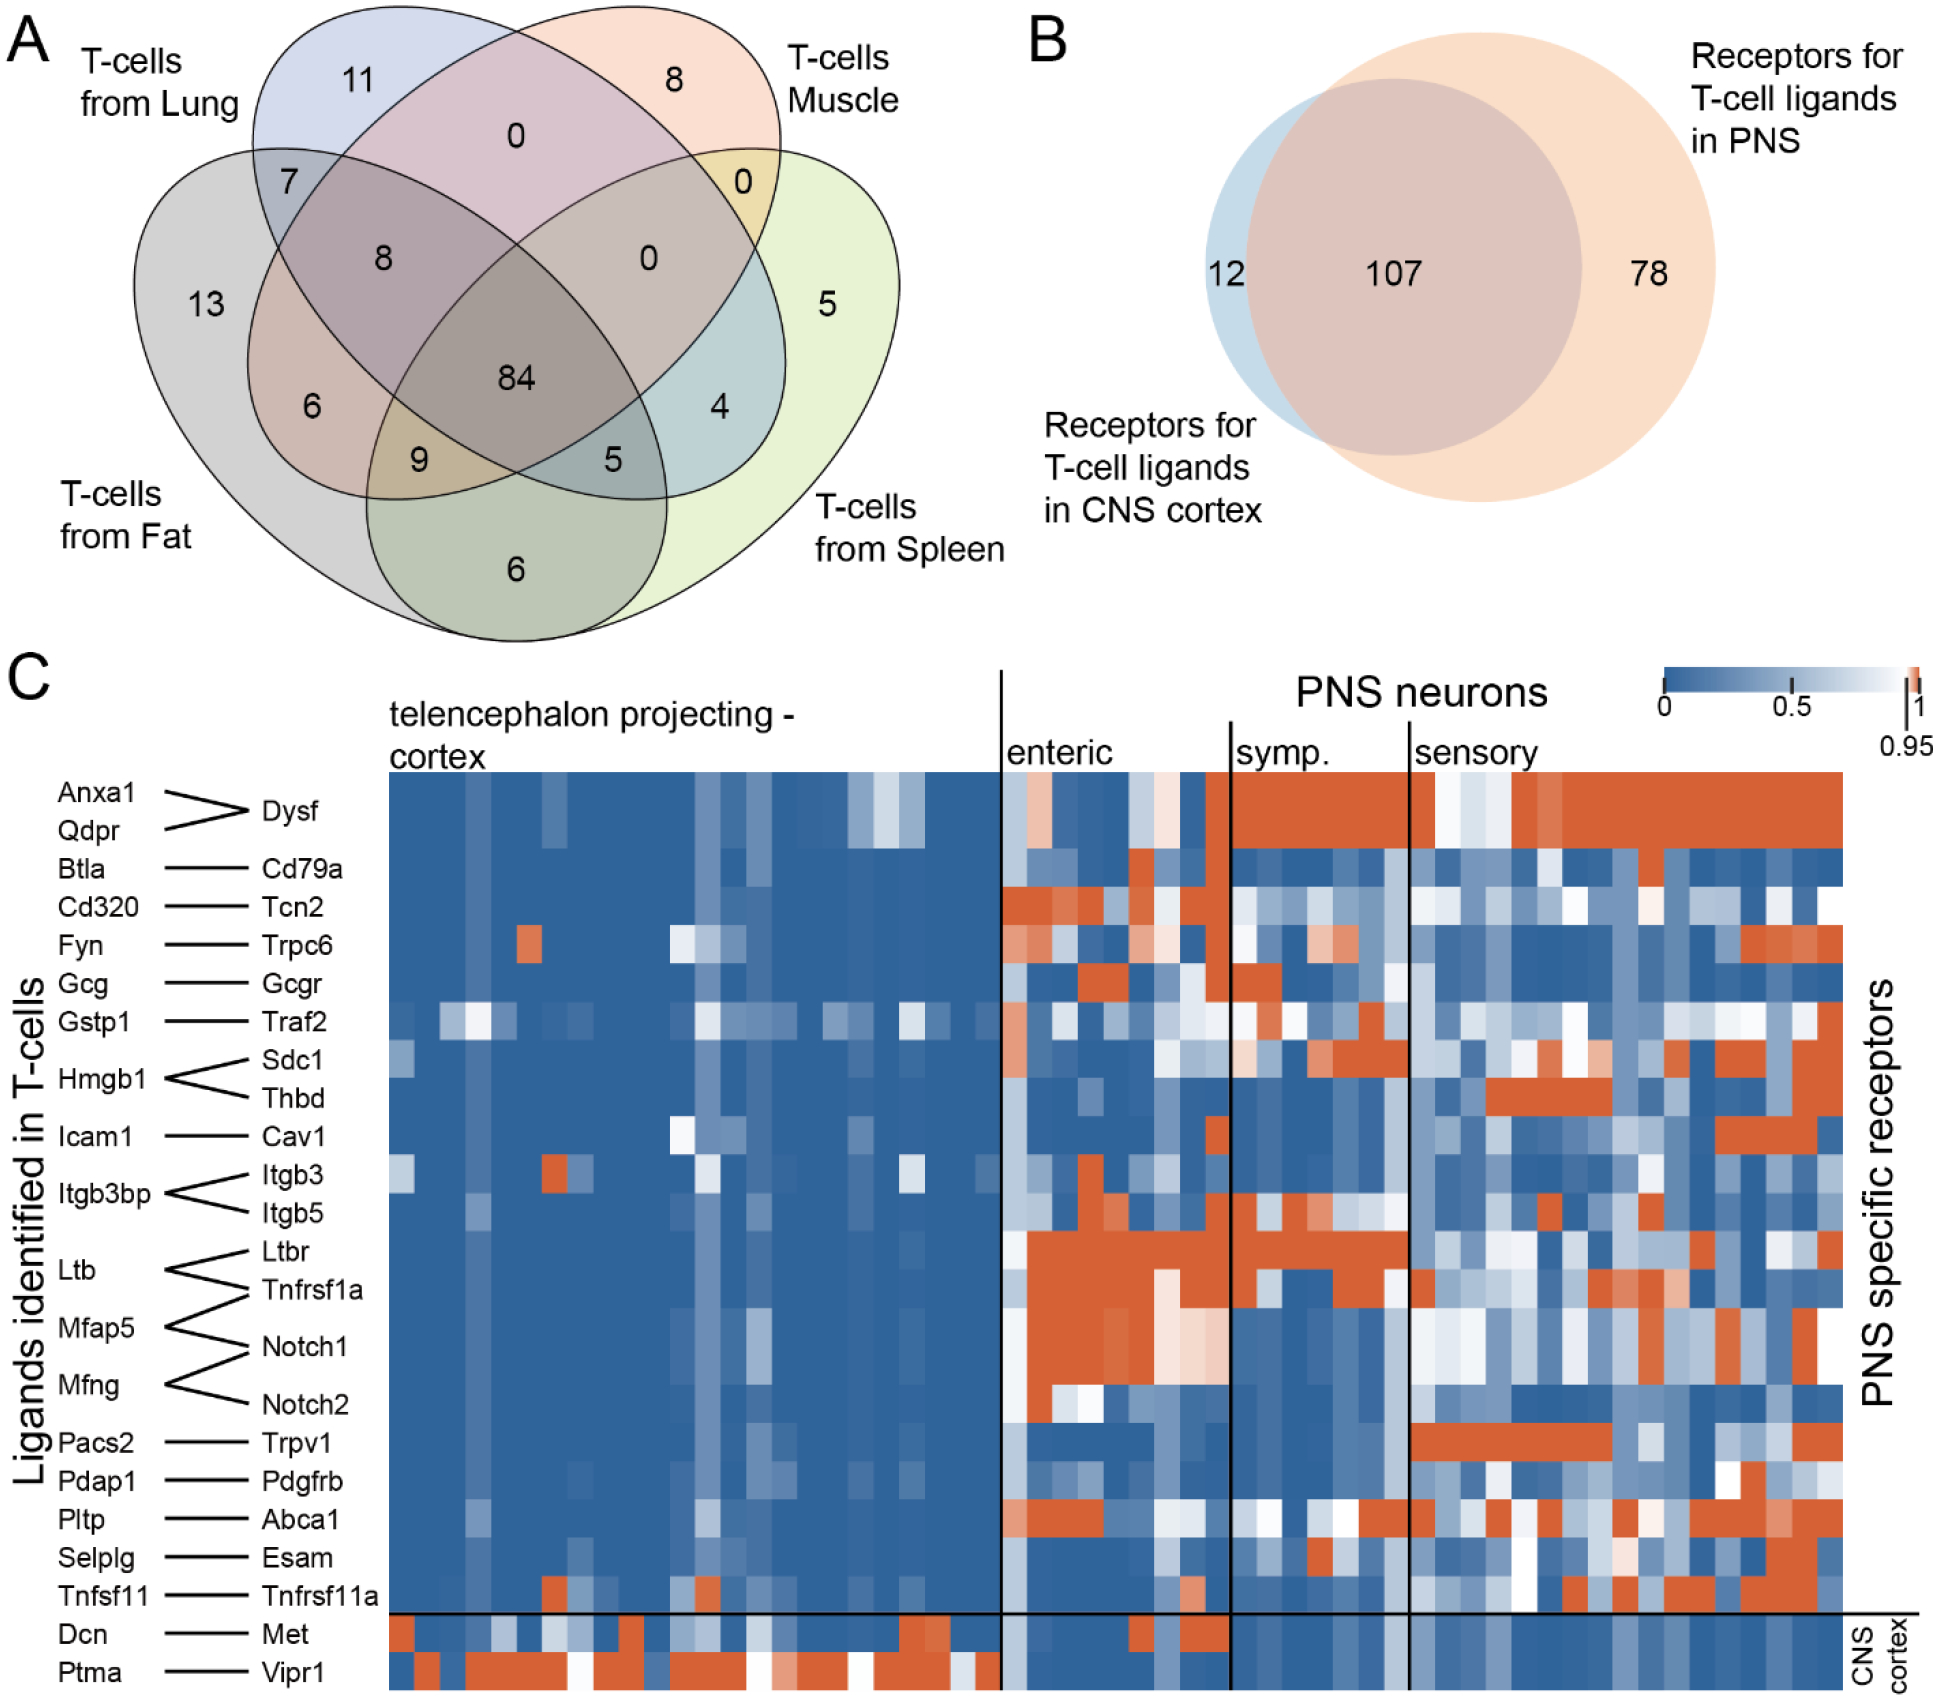
Figure 6. Ligand-receptor interactions identified between T-cells and CNS cortex or PNS neurons.

A) Venn diagram showing the number of ligands identified in T-cells from fat, lung, muscle, and spleen, where corresponding receptors are detected in either CNS cortex or PNS neurons. B) Venn diagram showing the number of receptors identified in CNS cortex vs. PNS neurons where corresponding ligands are identified in T-cells. C) Ligand-receptor interactions where the receptor is specifically expressed either in CNS cortex or PNS neurons. Pairs with ligands having multiple receptor genes commonly expressed across CNS cortex and PNS neurons are not shown in the graph for clarity.
