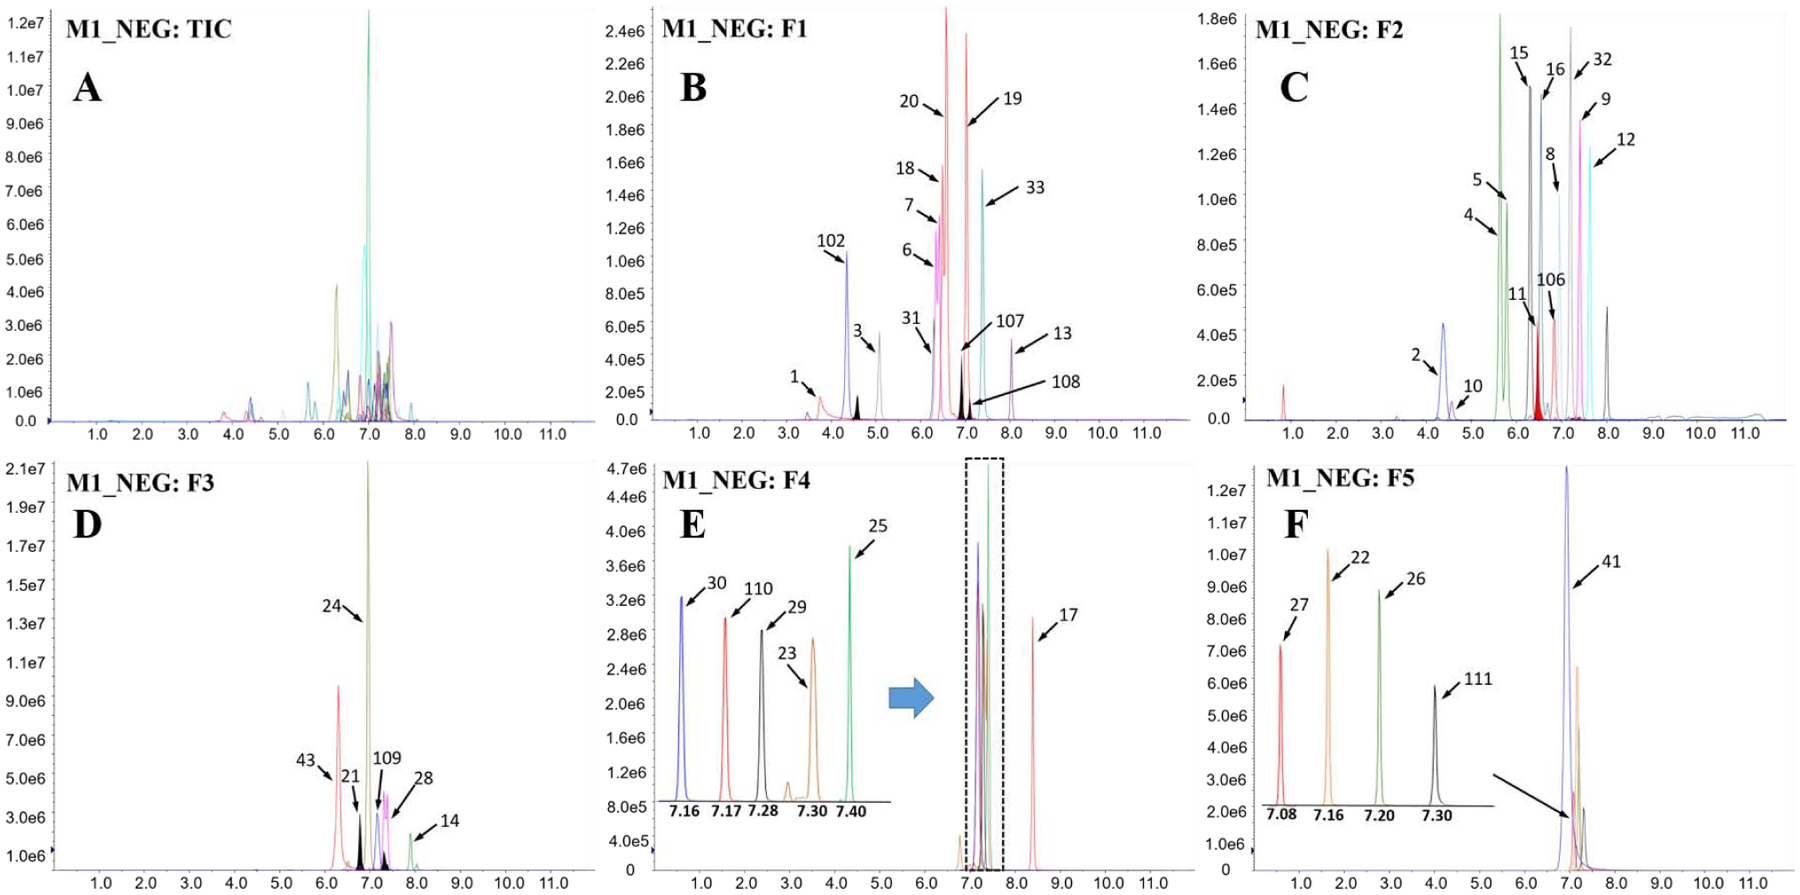
Figure 1. Total ion chromatogram (TIC; A) and extracted ion chromatograms (B–F) of 43 target compounds injected (5 μL) at a concentration of 10 ng/mL measured using mass spectrometric method 1 under negative mode (M1_NEG).

For the sake of distinction of individual compounds, ion chromatograms were extracted and divided into five fractions (i.e., F1–F5) depending on their retention times and signal intensities. Compound numbers assigned on the peaks are shown in Table 1. The x- and y-coordinates are retention time (min) and signal intensity (cps), respectively.
