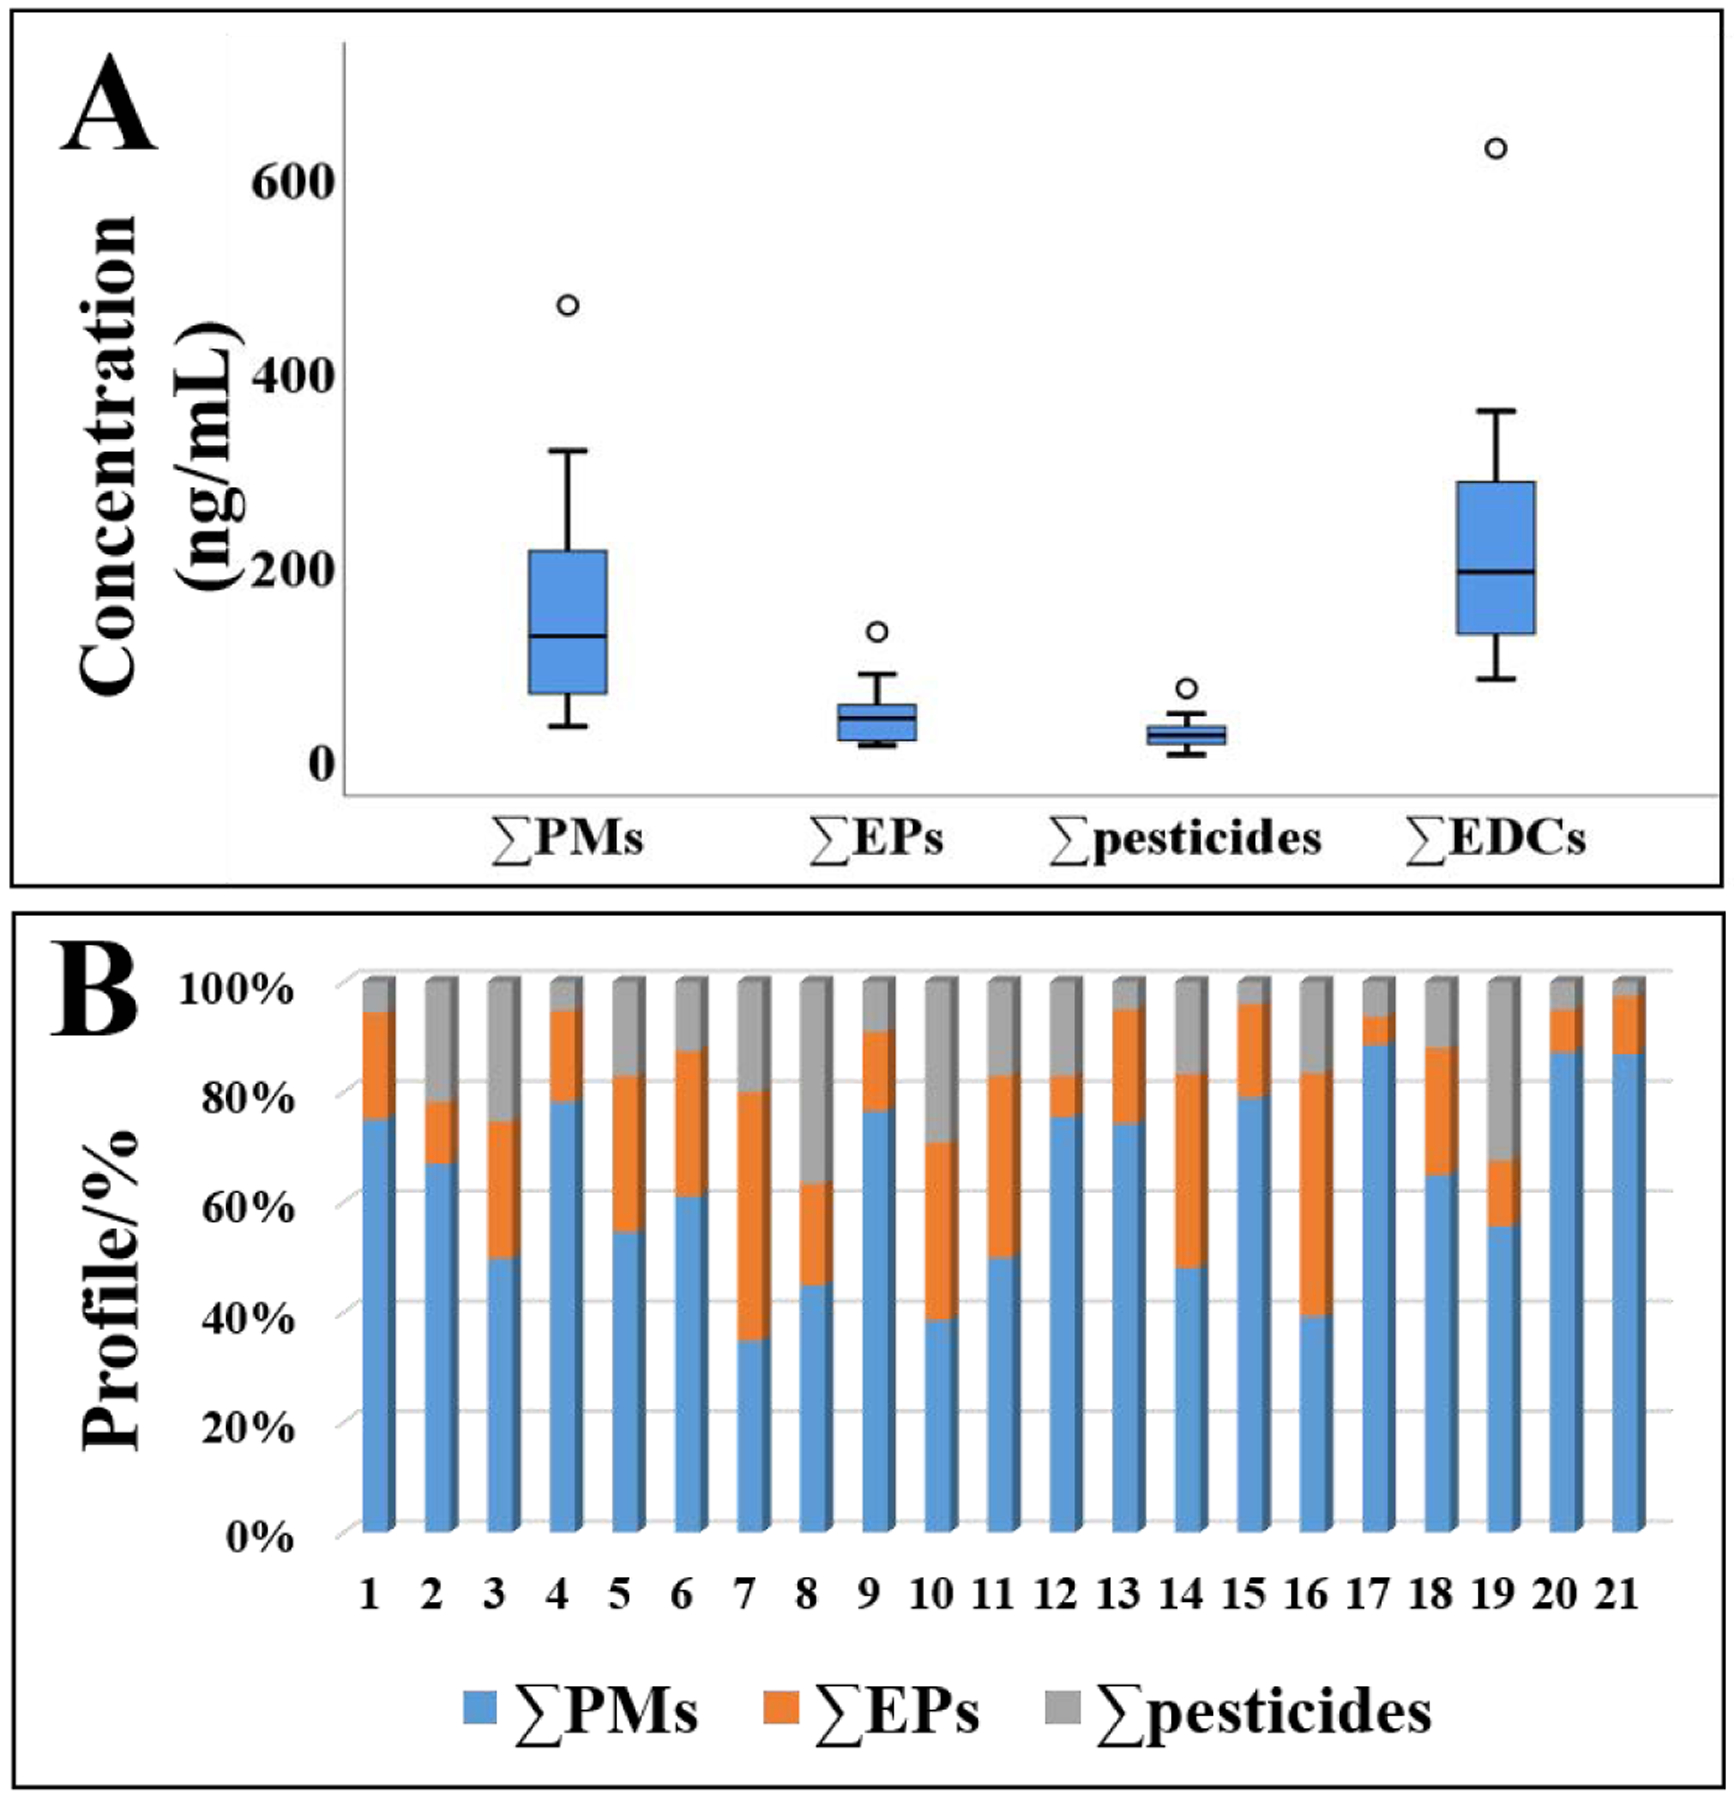
Figure 6. Concentrations (ng/mL; A) and profiles (%; B) of target chemicals found in 21 real urine analyzed.

PMs: plasticizers and metabolites; EPs: environmental phenols; The black horizontal line inside each box represents median, the boxes represent 25th and 75th percentiles, whiskers represent a value of 1.5*SD and the dots represent outliers.
