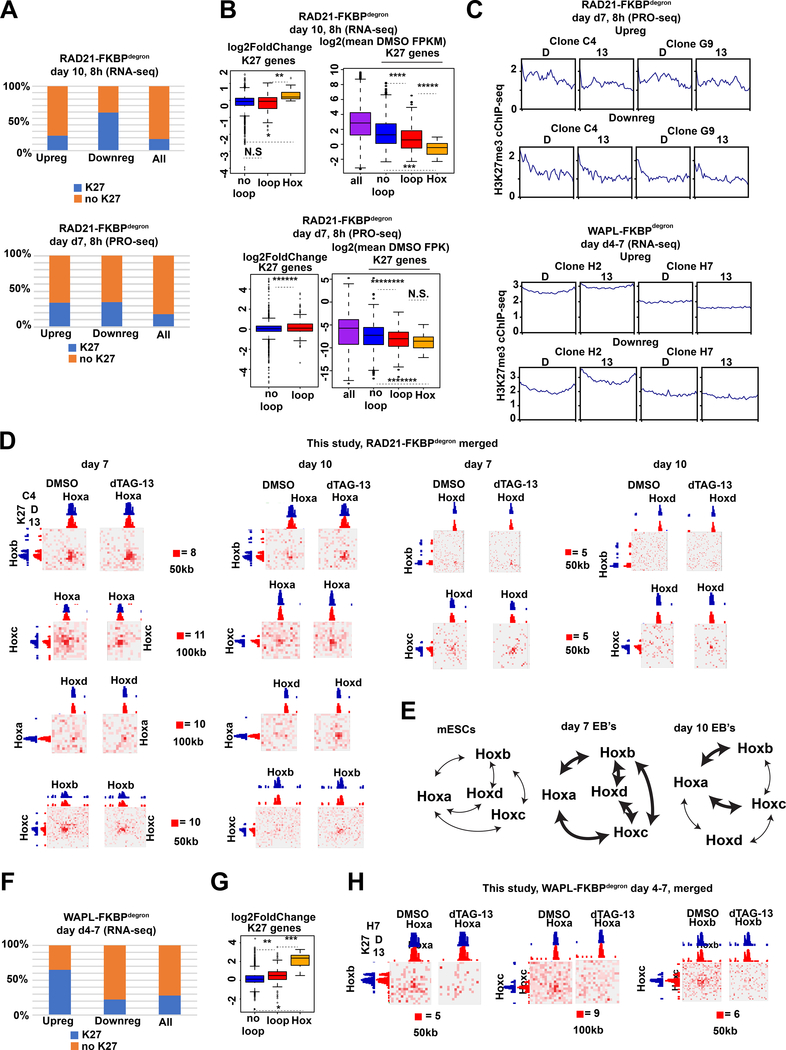
Fig.2: Polycomb loops protect against gene dysregulation upon cohesin loss, but increase sensitivity to cohesin gain during differentiation.
(A) Genes upregulated or downregulated after indicated time courses of RAD21 degradation (relative to DMSO control) overlapping with H3K27me3 cChIP-seq peaks. All genes shown for reference.
(B) RAD21-FKBPdegron RNA-seq (day 7: PRO-seq) DESeq2 log2-fold (dTAG-13/DMSO) change (left) or log2 FPKM (day 7: FPK, right, averaged between clones) of different categories of expressed (day 7: all) H3K27me3-marked genes. (No) loop: (not) overlapping anchor of H3K27me3-associated, cohesin-independent loop, Hox: Hox gene located in Hox cluster. All genes shown for reference. Significant p-values by Wilcoxon rank test indicated by * (p<7.344e-05), ** (p<0.0006566), *** (p<2.847e-05), **** (p<0.0005113), ***** (p<0.003082), ****** (p<0.0006716), ******* (p<0.001102), ********* (p<0.000146). N.S., not significant.
(C) Average DMSO and dTAG-13 H3K27me3 cChIP-seq signal over upregulated and downregulated genes in day 7 RAD21-FKBPdegron and WAPL-FKBPdegron samples.
(D) Inter-chromosomal Hi-C interaction maps between Hox cluster regions in RAD21-FKBPdegron lines at day 7 and day 10 at indicated resolutions (clones merged). H3K27me3 cChIP-seq signal in day 7 RAD21- FKBPdegron lines shown for reference (scale: 200).
(E) Schematic of inter-chromosomal Hox interactions in mESCs, day 7 and day 10 of differentiation. Bold arrows, interactions detected by Hi-C under control conditions.
(F) Genes upregulated or downregulated upon WAPL degradation from days 7–10 (relative to DMSO control) overlapping with H3K27me3 cChIP-seq peaks. All genes shown for reference.
(G) WAPL-FKBPdegron RNA-seq log2-fold (dTAG-13/DMSO) change of different categories of expressed H3K27me3-marked genes in WAPL-FKBPdegron lines. Categories as in (B). Significant p-values by Wilcoxon rank test indicated by * (p<6.703e-08), ** (p<1.462e-07), *** (p<4.638e-05).
(H) Inter-chromosomal Hi-C interaction maps between Hox cluster regions in WAPL-FKBPdegron lines (clones merged) at indicated resolutions. H3K27me3 cChIP-seq signal in day 7 WAPL- FKBPdegron lines shown for reference (scale: 100).

