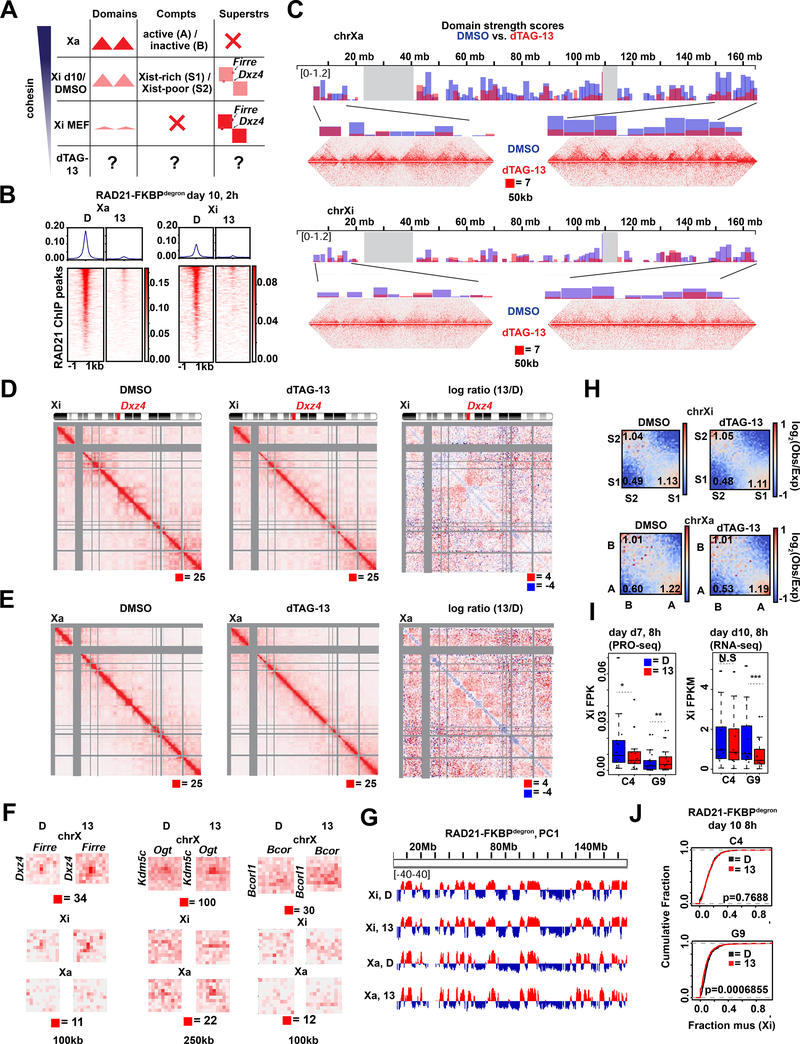
Fig 4. Cohesin is required for proper folding of the inactive X chromosome at day 10 of differentiation.
(A) Schematic of expected cohesin levels versus TAD, compartment, and superstructures detected on the X chromosome at different stages of XCI, based on prior studies. Levels corresponding to DMSO control and dTAG-13 treated cells indicated.
(B) Metaplot and heatmaps of active (Xa) and inactive (Xi) X chromosome RAD21 binding by uncalibrated ChIP-seq in day 10 RAD21-FKBPdegron embryoid bodies treated for 8 hours with 500nM dTAG-13 or DMSO.
(C) TAD scores calculated from day 10 Xa and Xi RAD21-FKBPdegron allelic Hi-C interaction maps binned at 100kb. DMSO and dTAG-13 samples as in (B). Representative Hi-C maps shown for the indicated regions (50kb resolution, clones merged).
(D) Chromosome-wide day 10 Xi RAD21-FKBPdegron Hi-C maps (250kb resolution, clones merged) and log2-ratio map (1Mb resolution). Treatment as in (B).
(E) Chromosome-wide day 10 Xa RAD21-FKBPdegron Hi-C maps (250kb resolution, clones merged) and log2-ratio map (1Mb resolution). Treatment as in (B).
(F) Day 7 composite X, Xi, and Xa Hi-C maps at Dxz4-Firre superloop (100kb resolution, clones merged), Kdm5c-Ogt loop (250kb resolution, clones merged) and Bcor-Bcorl1 loop (100kb resolution, clones merged). RAD21 and H3K27me3 cChIP-seq at superloop anchors shown for reference. Treatment as in (B).
(G) First Principal Component (PC1) tracks of day 7 Xa and Xi RAD21-FKBPdegron Hi-C maps. Treatment as in (B).
(H) Saddle plot analysis of compartment strength in RAD21-FKBPdegron Xi and Xa Hi-C maps (clones merged). Scores represent B-B (Xi: S2-S2), B-A (Xi: S2-S1), and A-A (Xi: S1-S1) compartment interaction strength. Treatment as in (B).
(I) Xi escapee (including Ogt, Bcor1, Bcorl1) gene expression in RAD21-FKBPdegron lines. Significant p-values by Wilcoxon signed rank test indicated by * (p<0.001663), ** (p<0.00232), *** (p<0.0002441). N.S., not significant.
(J) Cumulative distribution plots of allelic chromosome X and chromosome 13 expression by RNA-seq in RAD21-FKBPdegron lines. Treatment as in (B).

