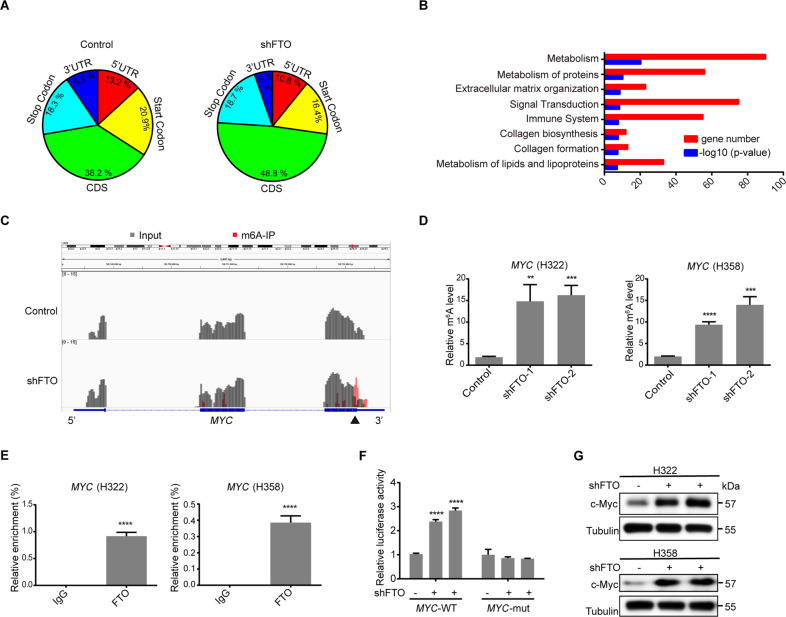
Fig. 3. FTO downregulation increases m6A of MYC mRNA, thereby enhancing c-Myc expression.
A m6A RNA sequencing (m6A-seq) of H322 cells with or without FTO depletion was conducted. The proportions of m6A peak distribution in the 5′ untranslated region (5′UTR), start codon, coding region (CDS), stop codon, and the 3′ untranslated region (3′UTR) across the entire set of mRNA transcripts were calculated. B m6A RNA sequencing (m6A-seq) of H322 cells with or without FTO depletion was conducted. Reactome pathway analysis of genes with increased m6A abundance (fold-change>4) in H322 cells with FTO depletion was performed. C m6A RNA sequencing (m6A-seq) of H322 cells with or without FTO depletion was conducted. The m6A enrichment on MYC mRNA is shown. A solid triangle indicates the region for qPCR analyses. D Methylated RNA in H322 (left) and H358 (right) cells with or without FTO depletion was immunoprecipitated with an m6A antibody followed by qPCR analyses with primers against MYC mRNA. Data represent the means ± SD of triplicate samples. **P < 0.01, ***P < 0.001, and ****P < 0.0001. E RIP analyses of H322 and H358 cells were performed with an anti-FTO antibody followed by qPCR analyses with primers against MYC mRNA. Data represent the means ± SD of triplicate samples. ****P < 0.0001. F Luciferase vectors with WT or mutated m6A nucleotides in the MYC gene were transfected into 293T cells with or without FTO depletion. Luciferase activity was measured. Data represent the means ± SD of triplicate samples. ****P < 0.0001. G H322 and H358 cells with or without FTO depletion were analyzed by immunoblotting analyses with the indicated antibodies.

