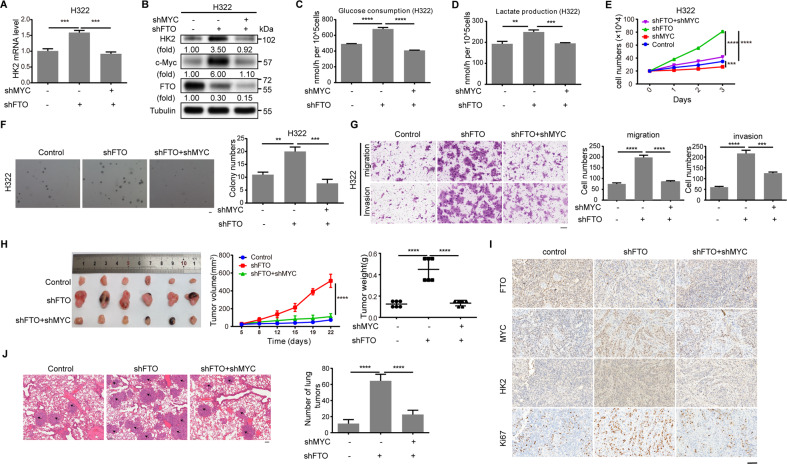
Fig. 5. FTO downregulation-induced c-Myc expression promotes tumor cell glycolysis, growth, invasion, and tumorigenesis in mice.
A qPCR analysis of H322 cells with or without FTO shRNA expression or combined expression of FTO shRNA and MYC shRNA was performed. Data represent the means ± SD of triplicate samples. ***P < 0.001. B Immunoblotting analysis of H322 cells with or without FTO shRNA expression or combined expression of FTO shRNA and MYC shRNA was performed with the indicated antibodies. C, D Glucose consumption (C) and lactate production (D) of H322 cells with or without expression of FTO shRNA or combined expression of FTO shRNA and MYC shRNA were determined. Data represent the means ± SD of triplicate samples. **P < 0.01, ***P < 0.001, ****P < 0.0001. E H322 cells with or without FTO shRNA or MYC shRNA were cultured for the indicated periods of time and were harvested for cell counting. The data represent the means ± SD of triplicate samples. ****P < 0.0001. F, G The anchorage-independent growth of H322 cells with or without expression of FTO shRNA or combined expression of FTO shRNA and MYC shRNA was measured by soft agar assays (F). Scale bar: 100 μm. The data represent the means ± SD of triplicate samples. The migration and invasion of the indicated cells were measured (G). Scale bar: 100 μm. The number of migrated and invaded cells were counted from 3 different fields under a microscope. The data represent the means ± SD. **P < 0.01, ***P < 0.001, and ****P < 0.0001. H, I H358 cells with or without expression of FTO shRNA or combined expression of FTO shRNA and MYC shRNA were subcutaneously implanted into the flank regions of nude mice (n = 6). Photographs of tumors, tumor growth curves and tumor weights are shown or calculated (H). Data represent the means ± SD of 6 mice in each group. IHC staining of tumor tissues was performed with indicated antibodies. Representative images are shown (I). Scale bar: 100 μm. **P < 0.01, ***P < 0.001, and ****P < 0.0001. J H358 cells with or without expression of FTO shRNA or combined expression of FTO shRNA and MYC shRNA were injected into the tail veins of NOD/SCID mice (n = 5). Mouse lungs were stained by H&E. Representative images of metastatic tumors in the lungs are shown. The black arrows indicate metastatic tumors. Scale bar: 100 μm. The number of tumors in the lung was counted. Data represent the means ± SD of 5 mice in each group. ****P < 0.0001.

