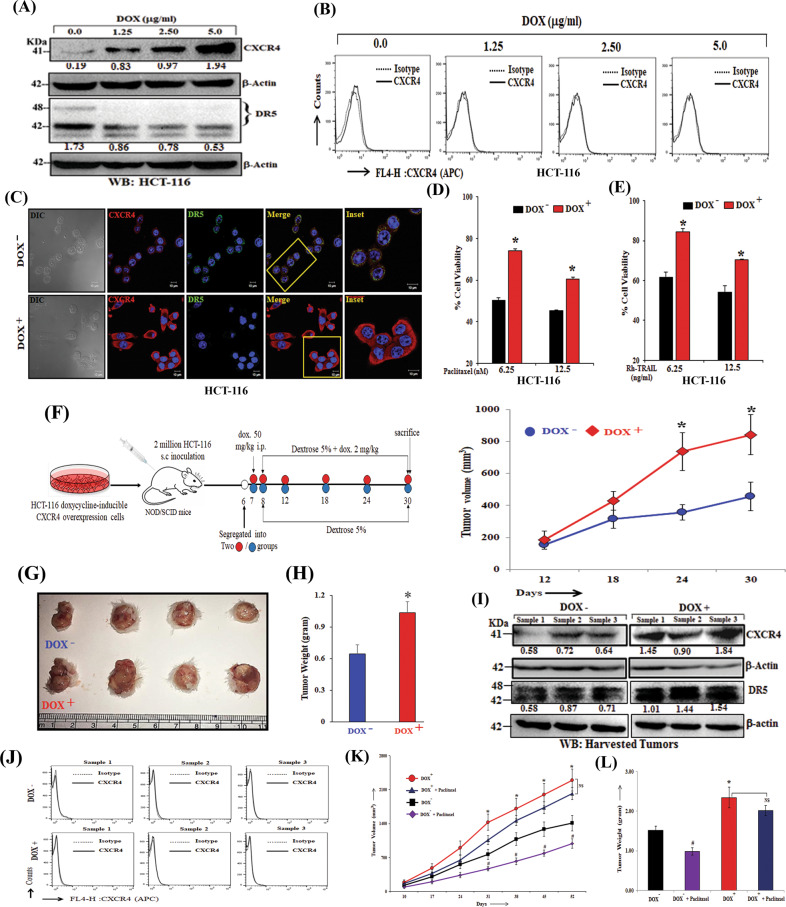
Fig. 6. Intra-cellular CXCR4 overexpression promotes tumorigenesis and paclitaxel resistance in vitro and in vivo.
A Western blot analysis of CXCR4 and DR5 in doxycycline-inducible CXCR4 overexpression HCT-116 cells after treatment with different concentrations of doxycycline (1.25 μg/ml, 2.50 μg/ml, 5 μg/ml) for 48 h. β-Actin was used as an internal protein loading control. B Doxycycline inducible CXCR4 overexpression HCT-116 cells were cultured under different concentrations of doxycycline (1.25 μg/ml, 2.5 μg/ml, 5 μg/ml) for 48 h. The cells were stained with APC-conjugated anti-human CXCR4 (CD184) antibody, and APC tagged IgG was used as isotype. The cells were analyzed by flow cytometry. Histogram overlays represent the surface expression level of CXCR4. C Doxycycline inducible CXCR4 overexpression HCT-116 cells were seeded on coverslips, treated with doxycycline (2μg/ml) for 48 h, subjected to immunofluorescence staining for CXCR4 as well as DR5 and analyzed by confocal microscopy. Inset photomicrographs represent the magnified area of the box. Scale bar, 10 µm. D Doxycycline inducible CXCR4 overexpression HCT-116 cells were treated with doxycycline (2 µg/ml) and Paclitaxel (6.25 nM, 12.5 nM) for 48 h and cytotoxicity was measured by SRB assay. Percent cell viability was tabulated. Columns, an average of triplicate readings of samples; error bars ± SEM. *p < 0.05 compared to uninduced cells. E Doxycycline inducible CXCR4 overexpression HCT-116 cells were treated with doxycycline (2 µg/ml) and TRAIL (6.25, 12.5 ng/ml) for 48 h and cytotoxicity was measured by SRB assay. Percent cell viability was tabulated. Columns, an average of triplicate readings of samples; error bars ± SEM. *p < 0.05 compared to un-induced cells. F–G, H In total, 2 × 10⁶ Doxycycline inducible CXCR4 overexpression HCT-116 cells in 100 μl PBS were injected subcutaneously in the right flank of 4–6 weeks old NOD/SCID mice respectively. Mice were fed with doxycycline (2 mg/ml, 5% dextrose in water). Tumor volumes were measured after regular intervals by using a digital caliper. Diagrammatic representation of experimental plan (F, left panel), tumor growth curve (F, right panel), harvested tumor pictures (G) and tumor weight bar graph (H) are shown. Results are reported as the mean ± SE. *p < 0.05 compared to vehicle-fed mice. I Western blot analysis of CXCR4 and DR5 in tumors harvested from the Dox- and Dox+ mice. β-Actin was used as an internal protein loading control. Western Blot densitometric quantification numbers are shown above the loading control blot of all immunoblot studies. J Single cells were isolated from the Dox+ and Dox− harvested tumors. The cells were either stained with APC-conjugated anti-human CXCR4 (CD184) antibody and PE-conjugated EpCAM (CD326) antibody or respective isotype control antibodies. The cells were analyzed by flow cytometry. Histogram overlays represent the surface expression level of CXCR4 in EpCAM positive HCT116 cell population. K, L In total, 5 × 10⁶ Doxycycline inducible CXCR4 overexpression HCT-116 cells in 100 μl PBS were injected subcutaneously in the flanks of the right or left hind leg of 4–6 weeks old NOD/SCID mice respectively. Mice were fed either with vehicle (5% dextrose in water) or doxycycline (2 mg/ml, 5% dextrose in water). Paclitaxel (5 mg/kg) was administered per week for 7 weeks. The tumor growth curve (K) and tumor weight (L) are shown, where points are indicative of the average value of tumor (n = 7) volume; mean ± SE. *p < 0.05 compared to vehicle-fed mice. #p < 0.05 compared to vehicle-fed mice.

