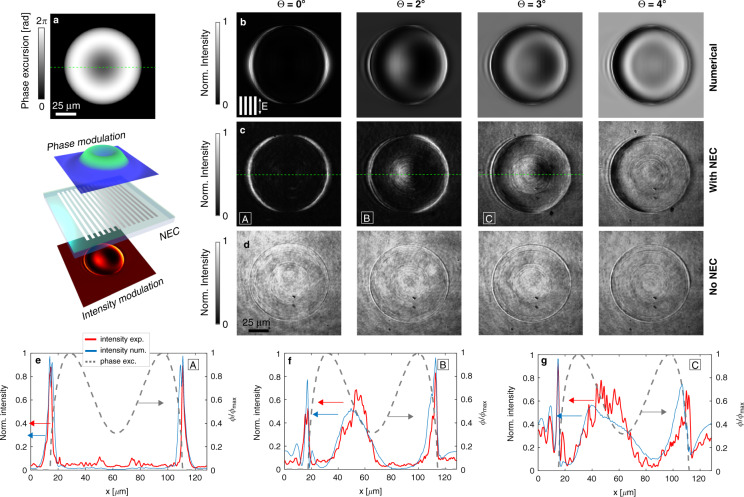
Fig. 3. Experimental phase visualisation showing the change in phase contrast with tilt angle of the NEC for incident light polarised along the grating stripes.
a The phase profile generated by the spatial light modulator, inspired by a magnified model of a red-blood cell, and the conceptual configuration using the NEC. b–d Four examples of phase imaging each with the incident light tilted at a different angle Θ relative to the NEC surface normal (b) calculated images, (c) measured images with the NEC, grating orientation and incident polarisation as indicated by inset in b. d Measurements without the NEC. e–g Profiles of the intensity along the dashed line through three images (red) as labelled by e A, f B, and g C that show quantitatively the increased transmission associated with phase gradients. Included in the graphs are the phase profile of the red-blood cell model (dashed grey) and the calculated contrast profiles (blue)

