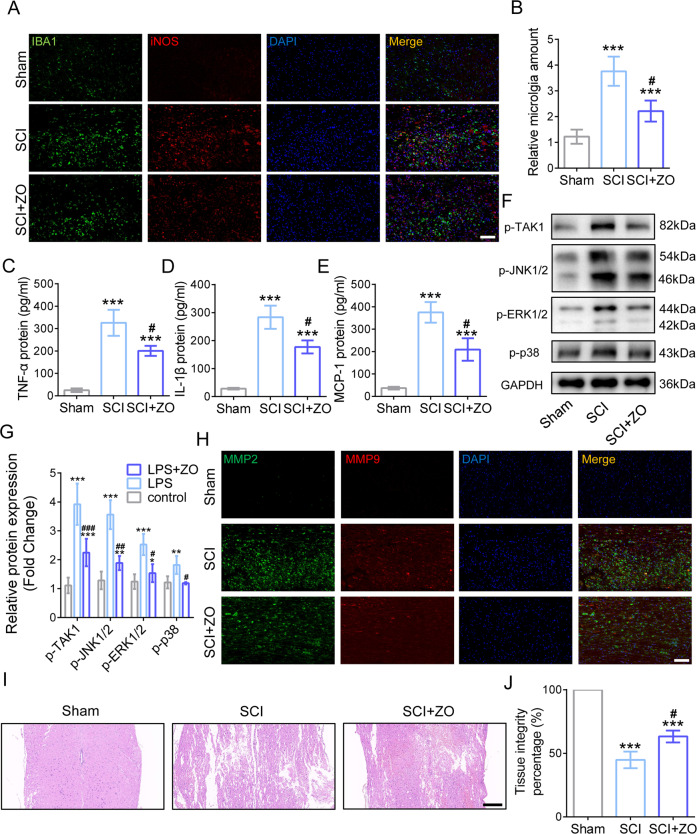
Fig. 4. TAK1 inhibition ameliorates neuroinflammation and tissue destruction caused by microglia and MMPs generation.
A Representative IF images of IBA1 and iNOS after LPS inducement and ZO administration; Bar scale = 100 μm. B The amount of microglia under LPS and TAK1 inhibition treatment. ∗∗∗P < 0.001 versus Sham group, # P < 0.05 versus SCI group. The protein levels of TNF-α, IL-1β, and MCP-1. ∗∗∗P < 0.001 vs. Sham group, # P < 0.05 vs. SCI group C–E. F Western blotting of p-JNK1/2, p-ERK1/2 and p-p38. G Quantification of p-JNK1/2, p-ERK1/2, and p-p38. ∗P < 0.05, ∗∗∗P < 0.001 versus Sham group, # P < 0.05, ## P < 0.01, ### P < 0.001 versus SCI group. H Representative IF images of the expressions of MMP2 and MMP9 in injured cords; Bar scale = 100 μm. I Representative HE staining photos of spinal cord in Sham, SCI, SCI + ZO group at 3dpi; Bar scale = 200 μm. J Quantification of tissue integrity in the spinal cord.

