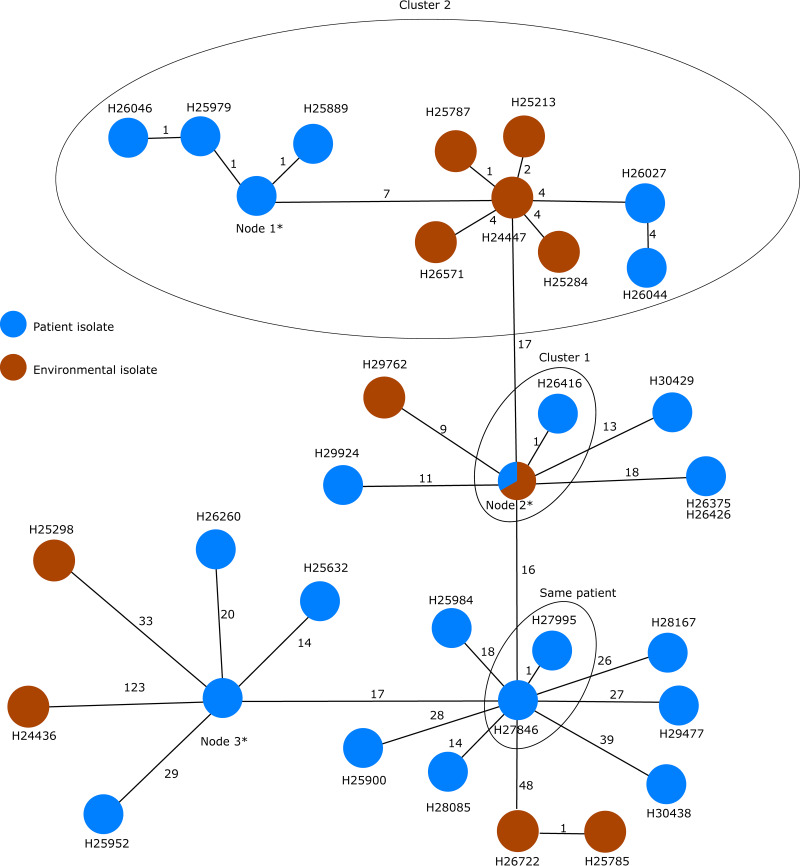
FIG 6.
Minimum spanning tree based on the allelic profiles of the genome data of all isolates (n = 45) with the MLST ST17 (including isolate H24436 with MLST ST845) gathered from Magalhães et al. (32). Each circle represents the genotype based on a unique allelic profile of up to 3,867 cgMLST genes (ignoring missing values in pairwise comparisons), and the numbers on connecting lines display the number of differing alleles. The circles are named according to the isolates and colored according to the status. If more than two isolates belong to the same node, the node is marked with an asterisk, and they comprise the following isolates: H26036, H26084, H26086, H26202, and H26203 in node 1; H25200, H25508, H25961, H26247, H26524, and H27791 in node 2; and H25718, H25723, and H25908 in node 3.

