
FIGURE 2.
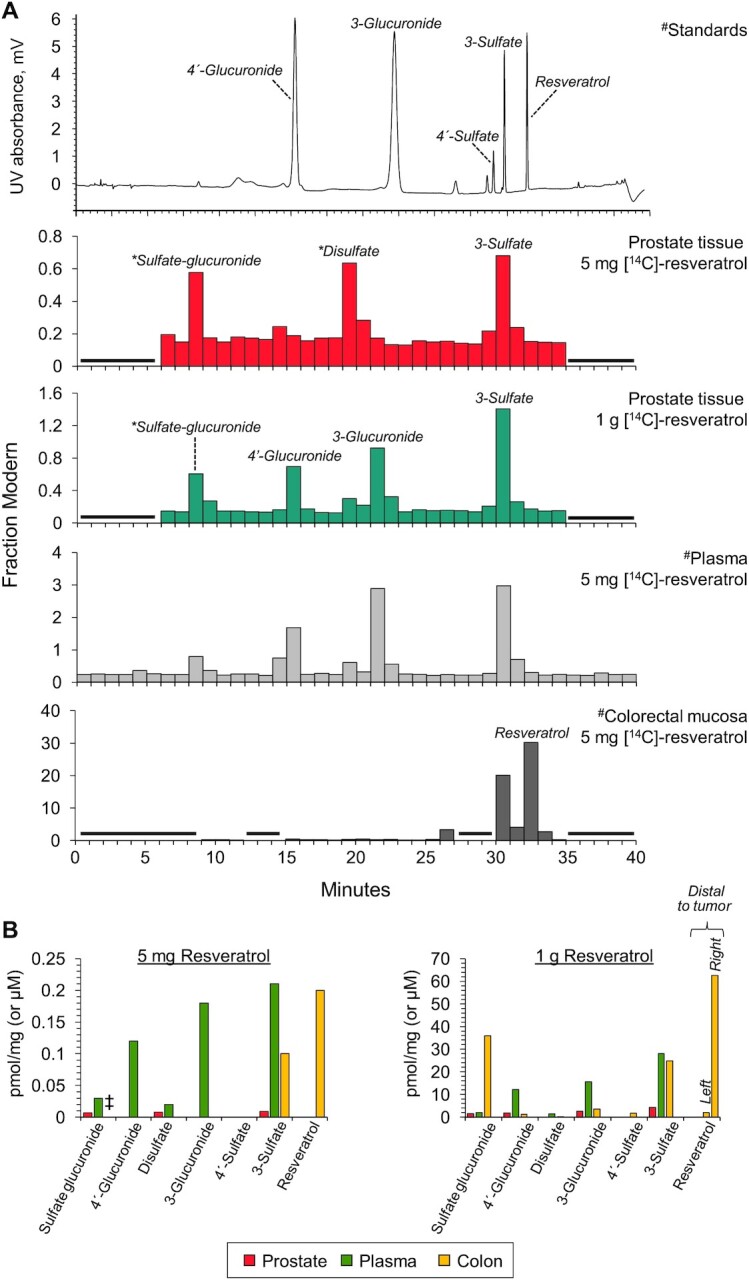
Metabolites of [14C]-resveratrol in human prostate tissue detected by HPLC-AMS and comparison with plasma and colorectal profiles. (A) Prostate tissue metabolite profiles determined by HPLC-AMS analysis of selected samples from 1 patient on each resveratrol dose. #Also included are previously published plasma and colorectal tissue profiles from healthy volunteers and colorectal cancer patients, respectively, given 5 mg [14C]-resveratrol, and a UV chromatogram from the analysis of authentic metabolite standards (11). These chromatograms are from Cai et al. Sci Transl Med. 7, 298ra117 (2015) and are reprinted with permission from AAAS. Peaks designated by * were assigned on the basis of their chromatographic properties and our previous LC-MS/MS analysis (21), because synthetic standards were not available. (B) Comparison of the achievable concentrations of resveratrol and its metabolites in human prostate, colorectal tissue, and plasma after ingestion of 5 mg or 1 g [14C]-resveratrol. For the 1 g dose, large variations in resveratrol concentrations have been observed between tissues arising from the right and left sides of the colon, therefore separate values have been included for tissue taken distal to the tumor. Concentrations are expressed as pmol/mg, which approximates to µM, assuming that 1 g tissue equates to 1 mL. Values for plasma and colorectal tissue (the green and yellow bars, respectively, in B) are from Cai et al. (11) and Patel et al. (21). ‡Indicates that the concentration of resveratrol sulfate-glucuronide was not previously analyzed in colorectal tissue of patients that received a 5 mg dose, whereas concentrations have been determined in patients that took 1 g resveratrol. AMS, accelerator mass spectrometry.