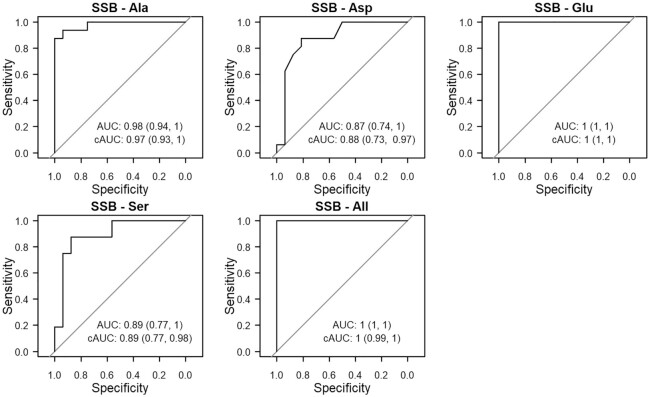
FIGURE 1.
Receiver operating characteristic curves for logistic regression models (n = 32) predicting SSB consumption using plasma CIRNEAA's as predictors. The cAUC (95% CI) was calculated using Harrell's bootstrap to adjust for optimism. cAUC, corrected AUC; CIR, carbon isotope ratio; NEAA, nonessential amino acid; SSB, sugar-sweetened beverage.

