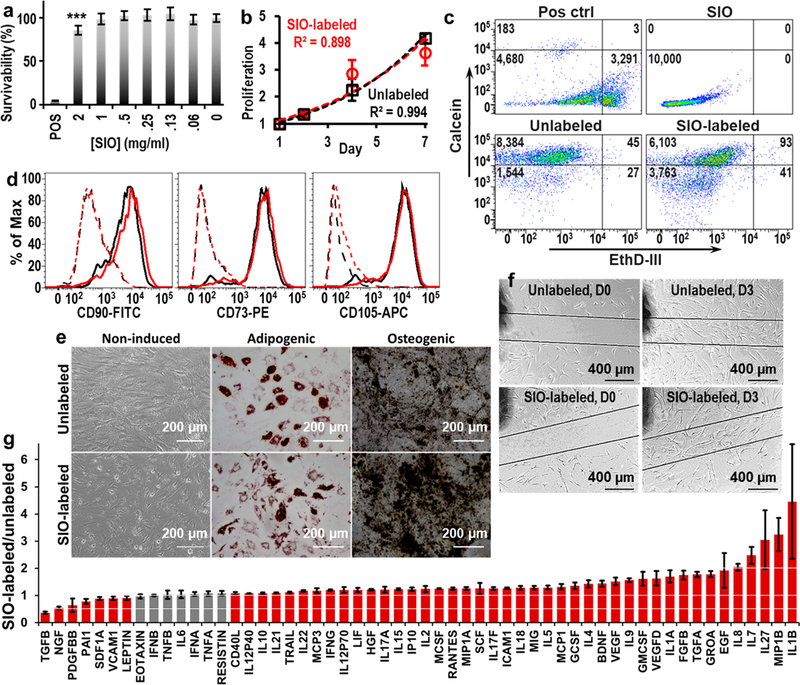
Figure 3.
Biocompatibility of SIO to hMSCs. (a) Resazurin assay showed no significant decrease in cell viability at SIO concentrations below 1 mg/mL. Error bars are standard deviations of six replicates; ***p < 0.0005. (b) Exponential fitting curves for proliferation of SIO-labeled and unlabeled hMSCs are similar, and the doubling times for SIO-labeled and unlabeled hMSCs were 3.6 and 3.7 days. Error bars are standard deviations of eight replicates. (c) Calcein/ethidium homodimer III live/dead assay shows that only 0.4% of cells died after being labeled with SIO. (d) Flow cytometry showed SIO-labeled hMSCs maintained the phenotypes—CD73, CD90, and CD105. Black and red lines are unlabeled and SIO-labeled hMSCs, respectively. Dashed lines are isotype control with isotype mouse IgG; solid lines are hMSCs stained with specific binding antibodies. (e) SIO-labeled hMSCs maintained their adipogenic and osteogenic differentiation ability. (f) SIO-labeled hMSCs showed normal migration. (g) Fold change of cytokines secreted by SIO-labeled and unlabeled hMSCs. SIO-labeled hMSCs secreted more than 200% of IL1B, IL27, IL7, IL8, and MIP1B and less than 50% of TGFB than unlabeled ones. Gray bars indicate a statistically nonsignificant (p > 0.05) change in expression; red bars indicate significance (p < 0.05) for the two-tailed homoscedastic test. Error bars are standard deviation of four replicates.

