Figure 5.
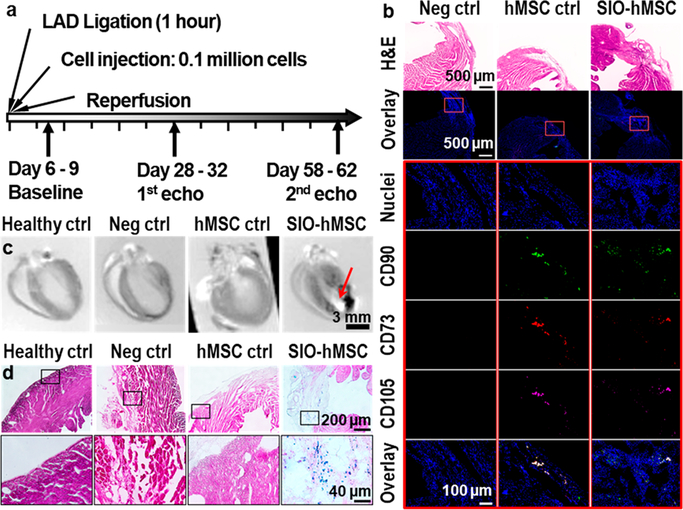
Timeline and confirmation of treatments in myocardium after 60 days. (a) Timeline for surgery, treatment, and echocardiograph. Hearts were collected and sliced more than 60 days after injection of hMSCs. (b) H&E staining (first row) and immunofluorescence (second row) images of heart slices from the injured groups. The third to seventh rows show higher-magnification images of the outlined regions (highlighted with red rectangles) from the second row. The results indicated the presence of hMSCs’ phenotypes CD73, CD90, and CD105 in heart slices from both hMSC control and IGF-loaded SIO-labeled hMSCs. (c) Ex vivo MRI showed the presence of SIO (pointed by red arrow) only in the IGF-loaded SIO-labeled hMSC treatment group. (d) Iron staining of heart slices from each group. Iron was stained blue; myocardium cells were stained dark pink, and fibrosis was stained light pink. The result shows the presence of iron only in the IGF-loaded SIO-labeled hMSCs treatment group.

